
Self-host LabTether
v1.4.0Cross-platform homelab control plane with AI ops
- Stars
- 234
- Ports
- 3000 (Web console), 8080 (HTTP listener (health checks, redirects)), 8443 (HTTPS listener), 4822 (guacd (remote desktop proxy)), 8090 (Agent HTTP listener)
- Requires
- Guacd, PostgreSQL




What is LabTether?
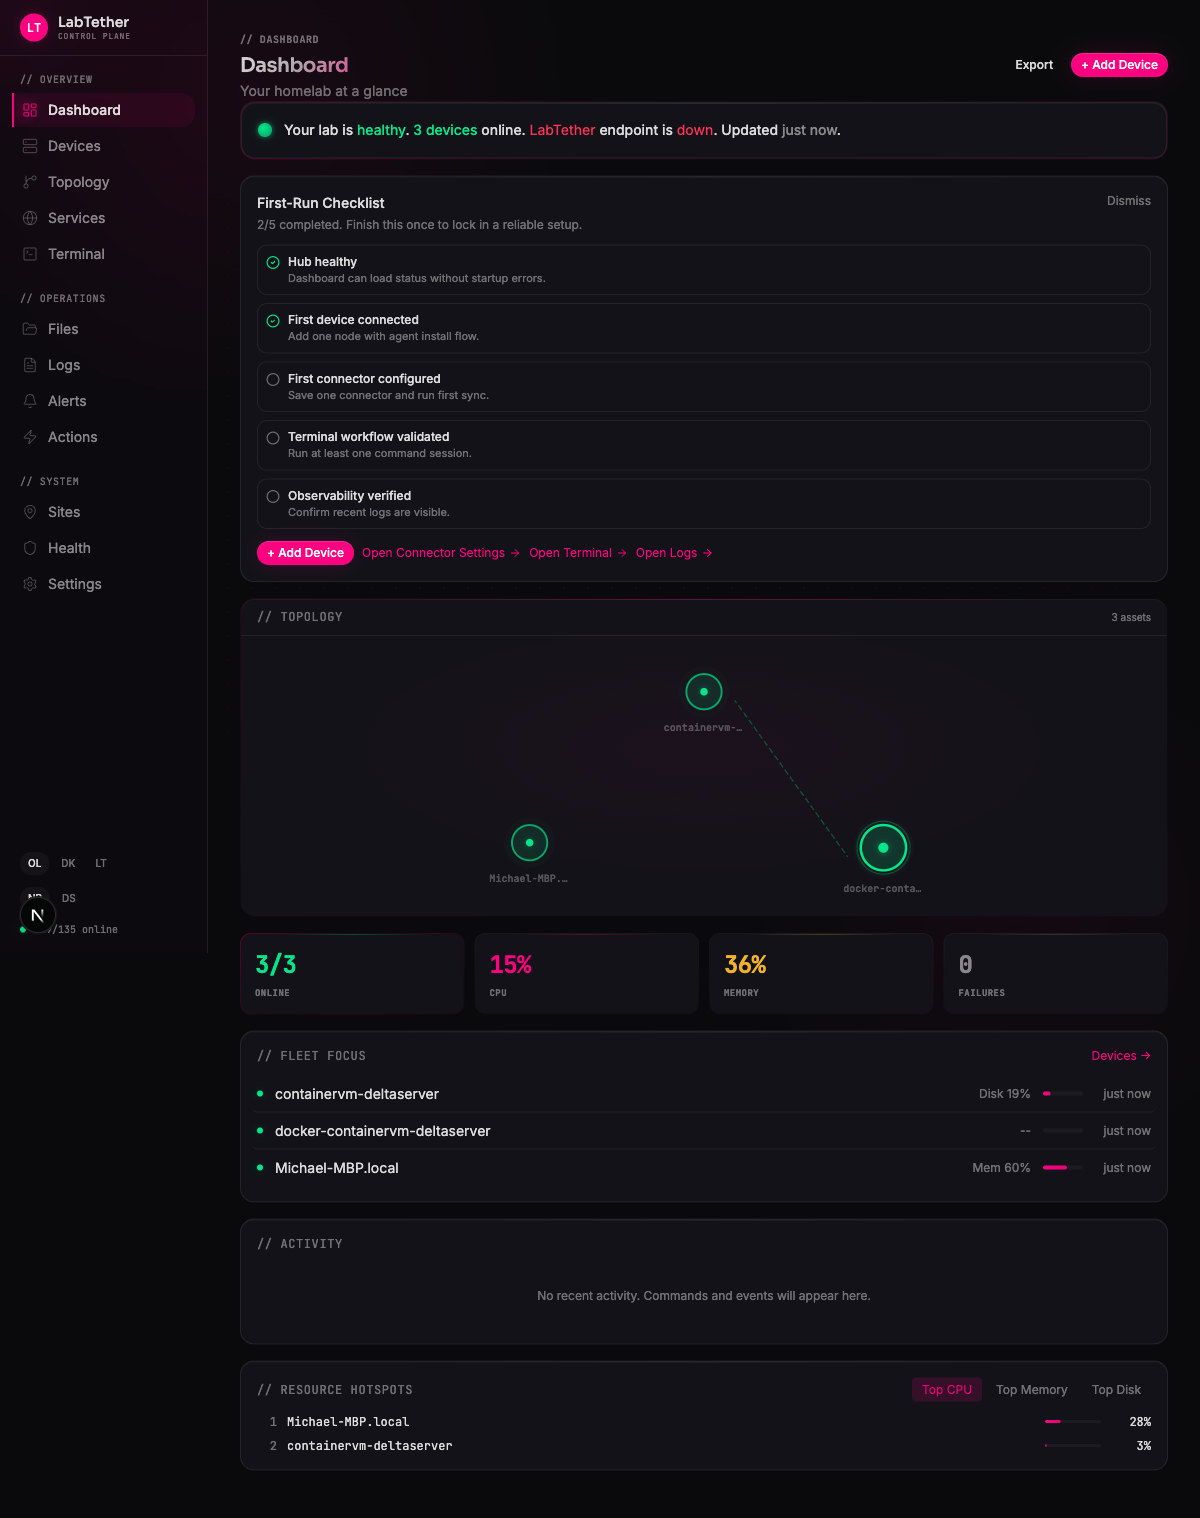
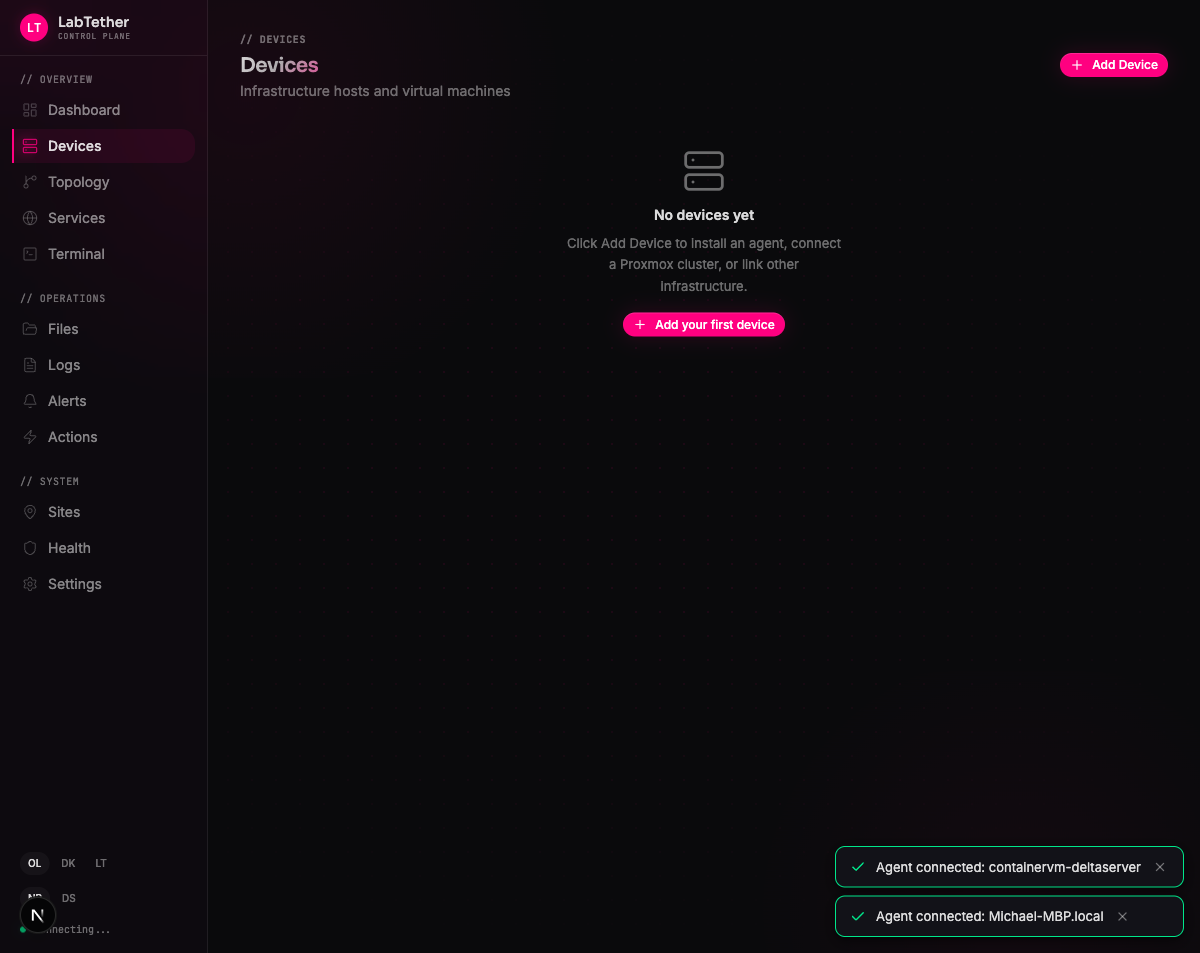
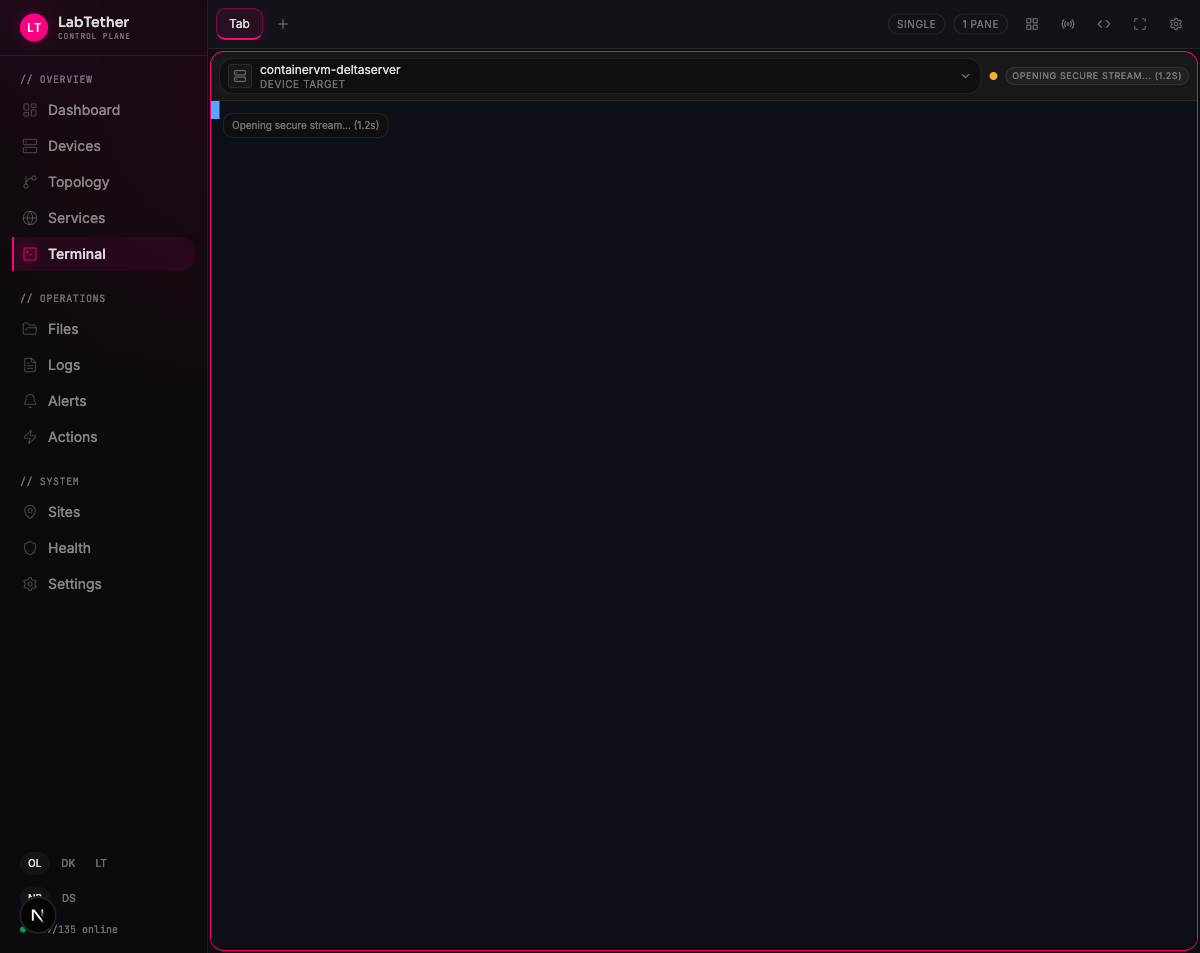
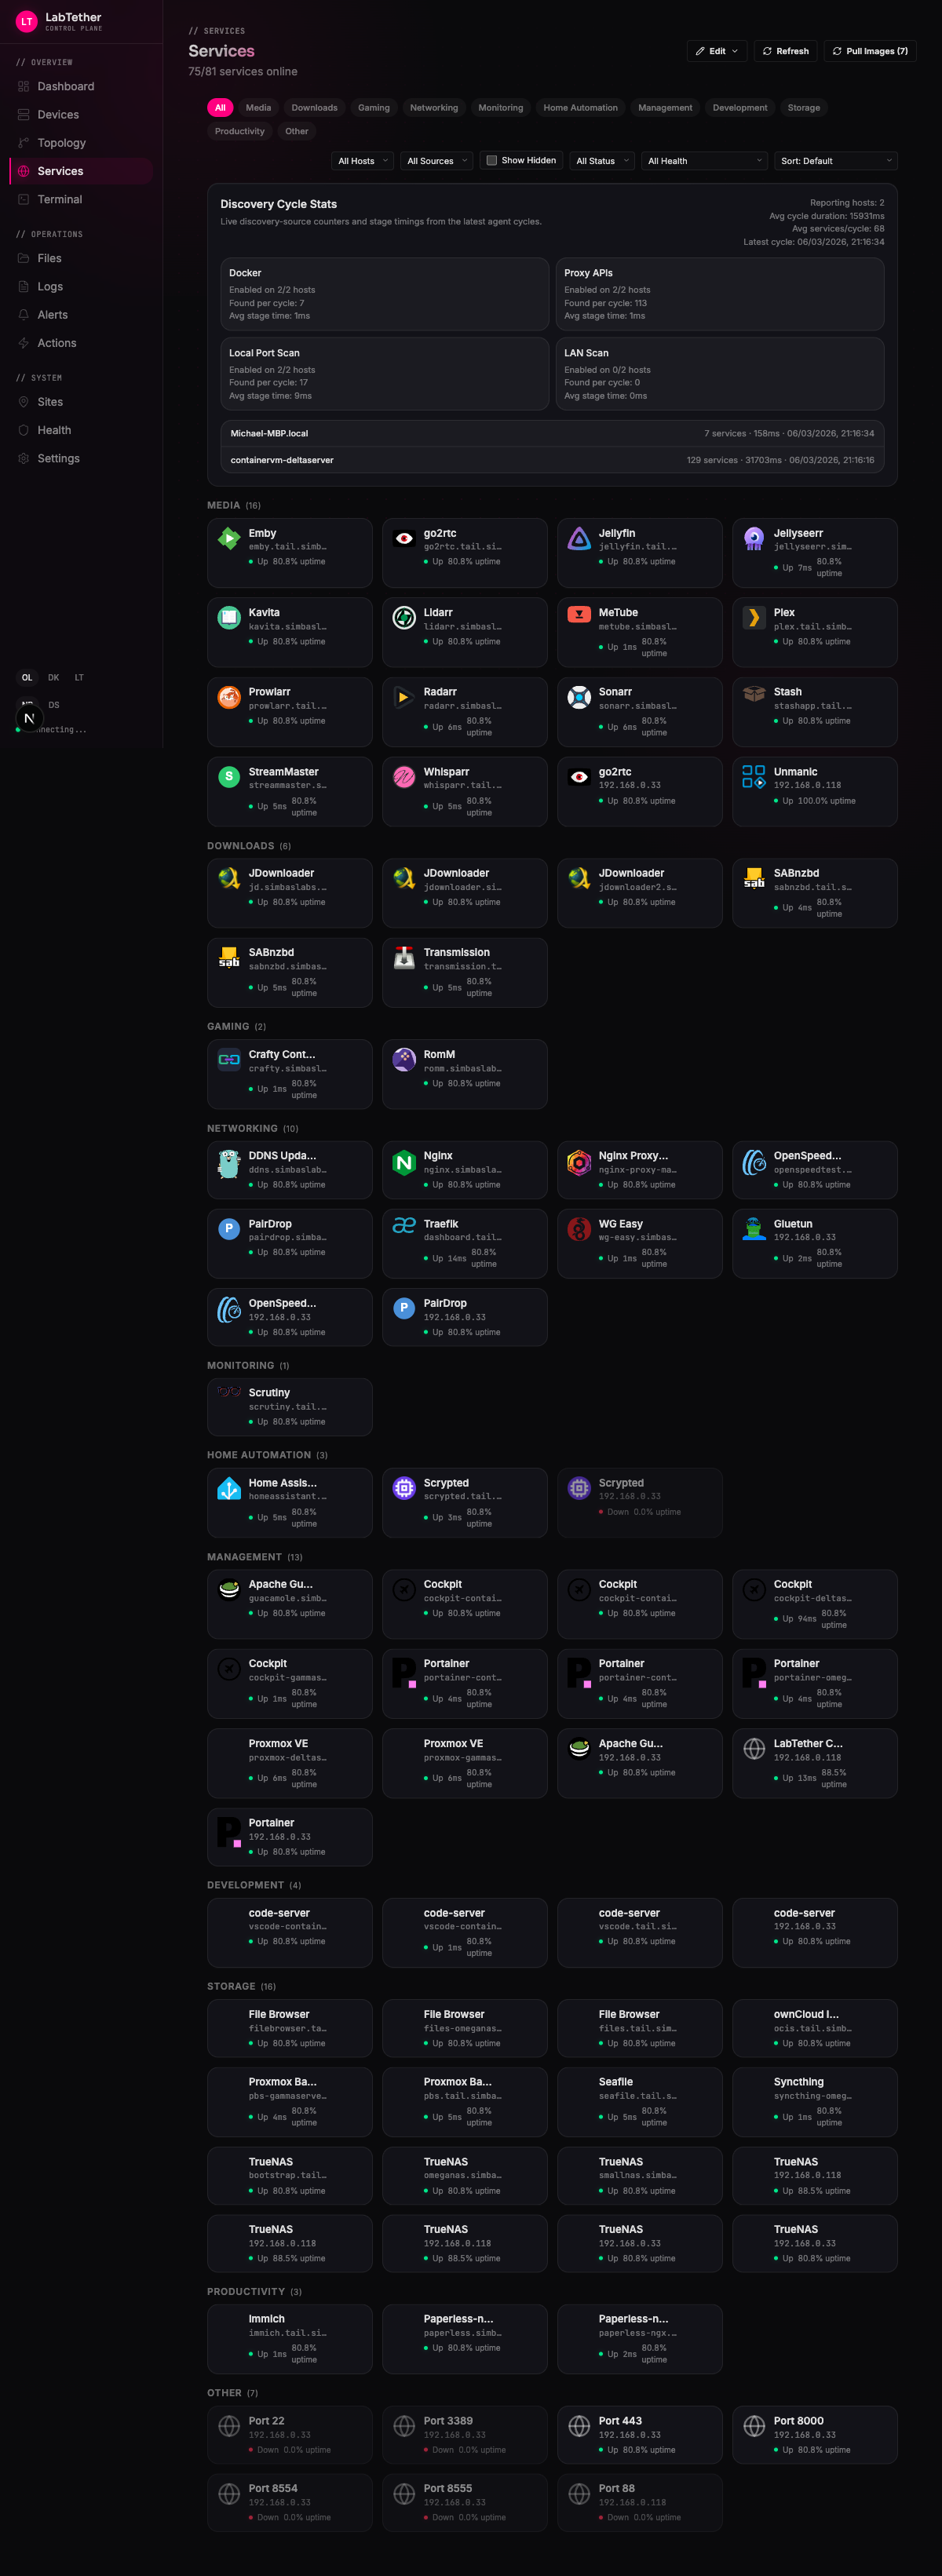
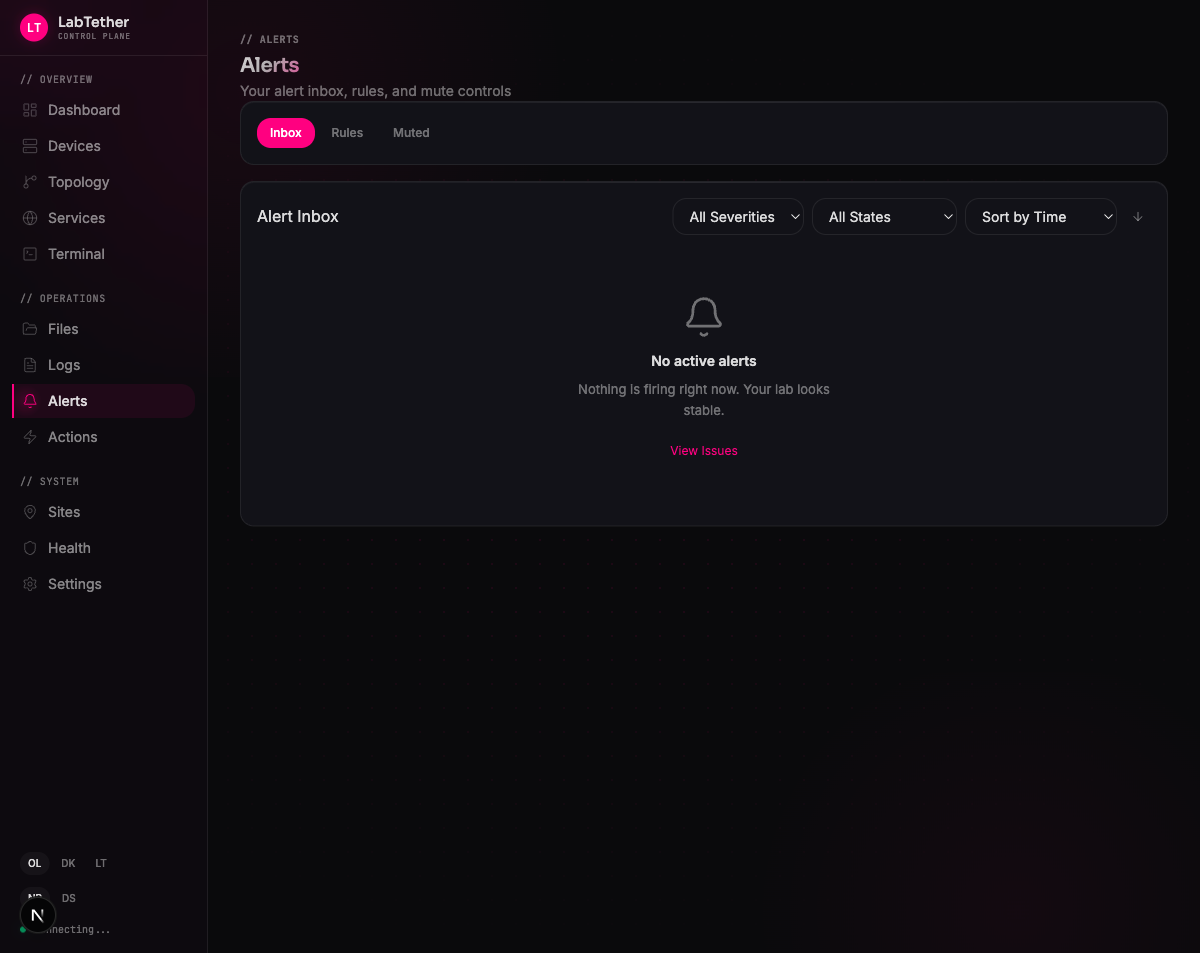
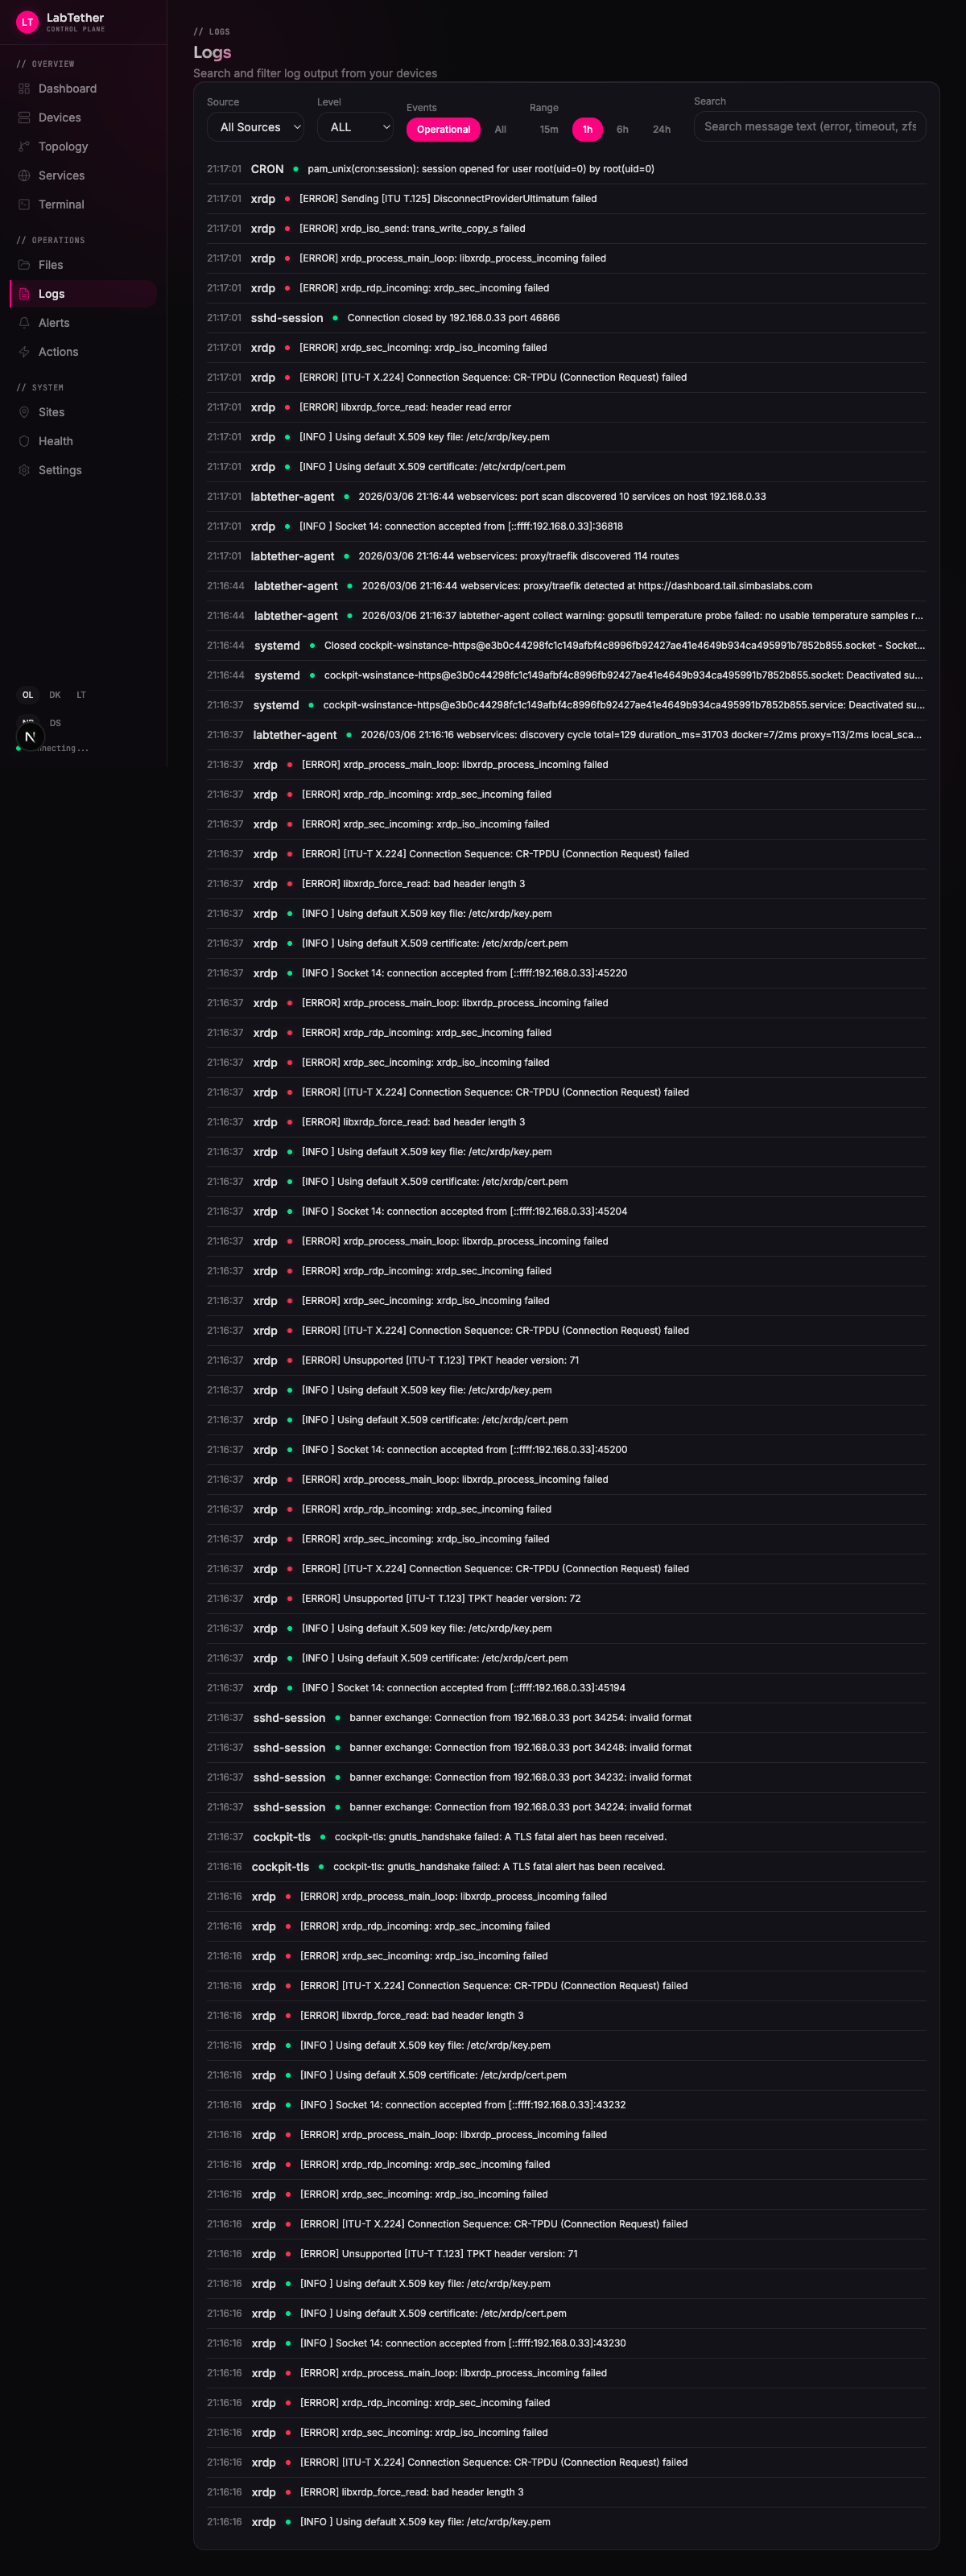
LabTether is a self-hosted homelab control plane that provides a unified dashboard for managing infrastructure including Proxmox VE, TrueNAS, Docker, Portainer, and Home Assistant. It features an AI agent gateway with built-in MCP server (23+ tools) for natural language operations, remote terminal and desktop access, file management, alerts and incident tracking, topology visualization, and automation. It runs via Docker Compose with PostgreSQL, supports Tailscale for secure remote access, and offers 2FA, OIDC/SSO, RBAC, and audit logs. Agents are available for Linux, macOS, and Windows (partial) for deeper telemetry and remote operations.
Should you self-host LabTether?
LabTether scores 51/100 on selfhost.directory (how scoring works) and ranks #8 of 19 in Infrastructure Monitoring. It has 234 GitHub stars.
It shipped 5 stable releases in the past year. The latest, v1.4.0, came out on 17 April 2026.
Setup is moderate: expect some configuration beyond a single command. It is Apache-2.0-licensed and written mostly in Go.
Its closest alternative on selfhost.directory is Beszel (81/100, 26 614 stars). It scores higher overall, so compare the two before you pick. See LabTether vs Beszel side by side.
Features
- Unified Dashboard
LabTether README
More in Infrastructure Monitoring
 LinnixLinnix is a self-hosted eBPF agent that attributes stalls to specific processes and pods, finding noisy neighbors without SaaS.
 LunalyticsA self-hosted, open-source monitor for sites, servers, and containers that handles multiple users, public status pages, and over a hundred alert channels.
 lxd-dashboardSelf-hosted web UI for managing multiple LXD servers, containers, and VMs with snapshots, backups, RBAC, and web terminal.
 maintenantSelf-hosted monitoring auto-discovering Docker, Swarm, and Kubernetes containers, endpoints, TLS certs, cron jobs, and host resources from one Go binary (~100MB).
 naemon-coreNaemon is a self-hosted, open-source network monitoring application forked from Nagios 4 with Thruk web UI, Livestatus API, and full Nagios plugin compatibility.
 nagiosOpen-source, self-hosted monitoring engine written in C that checks network services and host resources, alerts on problems, and adds an optional CGI web interface.
 netdataNetdata is an open-source, self-hosted infrastructure monitoring platform with per-second metrics, automated dashboards, ML anomaly detection, and zero-config deployment.
 netxmsSelf-hosted, open-source network monitoring with L2/L3 topology discovery, distributed agents, NXSL scripting, and no node limits on Linux.
 nightmendSelf-hosted AI monitoring platform that auto-diagnoses and remediates alerts using DeepSeek AI and 13 runbooks, with MCP integration.
 openDCIMopenDCIM is a self-hosted, open-source DCIM app for tracking assets, managing capacity (space, power, cooling), and fault tolerance across data center rooms.
 openITCOCKPITSelf-hosted open-source monitoring platform with web UI for Nagios, Naemon, Prometheus, featuring dashboards, alerting, Grafana, and native mobile apps.
 opnsense-exporterSelf-hosted Prometheus exporter for OPNsense metrics via REST API — ARP, WireGuard, Unbound, OpenVPN, IPsec, firewall, firmware, DHCP, temperature, CARP. Grafana dash.
0 comments