
Self-host netdata
v2.12.3Real-time infrastructure monitoring with per-second metrics
- Stars
- 81 421
- Rating
- 5.0 (1)
- CPU
- ~5% CPU
- RAM
- 150MiB RAM
- Storage
- 3GB disk for >1 year retention
- Port
- 19999 (Web UI and API)
netdata/netdata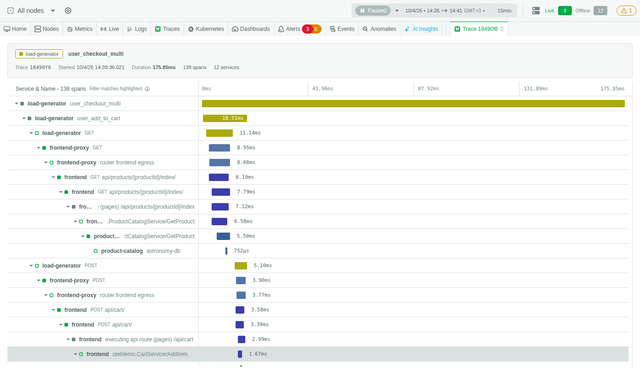
What is netdata?
Netdata is an open-source monitoring platform that collects per-second metrics from systems, containers, applications, and network devices. It auto-discovers over 800 integrations, runs ML anomaly detection on every metric, and provides algorithmic dashboards that need no query language. The agent runs on Linux, Windows, macOS, FreeBSD, Docker, and Kubernetes using roughly 5% CPU and 150 MB RAM. A parent-child architecture enables horizontal scaling. Netdata Cloud (optional) adds remote access, SSO, RBAC, and centralized configuration. The core agent is GPLv3+ licensed; the UI and Cloud components are proprietary with free tiers.
Should you self-host netdata?
netdata scores 86/100 on selfhost.directory (how scoring works) and ranks #4 of 105 in Monitoring & observability. It has 81 421 GitHub stars, +530 in the last 30 days.
It shipped 17 stable releases in the past year. The latest, v2.12.3, came out on 4 November 2026. New versions land roughly every 2 weeks.
Setup is easy: most people get it running in one sitting. An official Docker image is available. It is GPL-3.0-licensed and written mostly in Go.
Its closest alternative on selfhost.directory is Langfuse (85/100, 37 443 stars). netdata scores higher overall. See netdata vs Langfuse side by side.
Features
- Algorithmic dashboards
- Container Monitoring
- Distributed parent-child architecture
- eBPF monitoring
- Log Management
- ML-Powered Anomaly Detection
- Multi-channel alerting
- Network Monitoring
- Per-second metrics collection
- Synthetic checks
- Tiered long-term retention
netdata README
Visit our Home Page
MENU: WHO WE ARE | KEY FEATURES | GETTING STARTED | HOW IT WORKS | FAQ | DOCS | COMMUNITY | CONTRIBUTE | LICENSE
Warning
People get addicted to Netdata. Once you use it on your systems, there's no going back.
Netdata is an open-source, real-time infrastructure monitoring platform. Monitor, detect, and act across your entire infrastructure.
Core Advantages:
- Instant Insights – With Netdata you can access per-second metrics and visualizations.
- Zero Configuration – You can deploy immediately without complex setup.
- ML-Powered – You can detect anomalies, predict issues, and automate analysis.
- Efficient – You can monitor with minimal resource usage and maximum scalability.
- Secure & Distributed – You can keep your data local with no central collection needed.
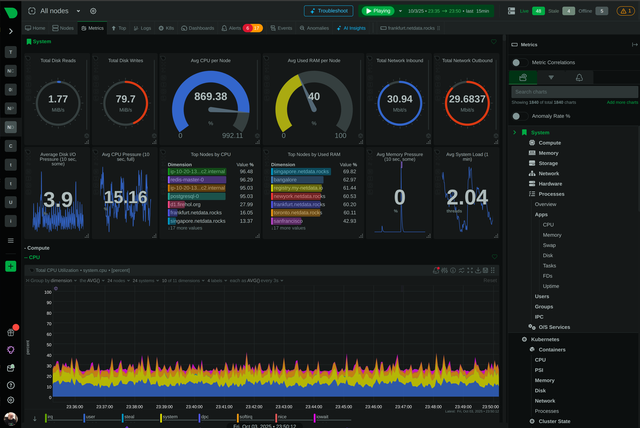
With Netdata, you get real-time, per-second updates. Clear insights at a glance, no complexity.
All heroes have a great origin story. Click to discover ours.
In 2013, at the company where Costa Tsaousis was COO, a significant percentage of their cloud-based transactions failed silently, severely impacting business performance.
Costa and his team tried every troubleshooting tool available at the time. None could identify the root cause. As Costa later wrote:
“I couldn’t believe that monitoring systems provide so few metrics and with such low resolution, scale so badly, and cost so much to run.”
Frustrated, he decided to build his own monitoring tool, starting from scratch.
That decision led to countless late nights and weekends. It also sparked a fundamental shift in how infrastructure monitoring and troubleshooting are approached, both in method and in cost.


According to the University of Amsterdam study, Netdata is the most energy-efficient tool for monitoring Docker-based systems. The study also shows Netdata excels in CPU usage, RAM usage, and execution time compared to other monitoring solutions.
| Feature | Description | What Makes It Unique |
|---|---|---|
| Real-Time | Per-second data collection and processing | Works in a beat – click and see results instantly |
| Zero-Configuration | Automatic detection and discovery | Auto-discovers everything on the nodes it runs |
| ML-Powered | Unsupervised anomaly detection | Trains multiple ML models per metric at the edge |
| Long-Term Retention | High-performance storage | ~0.5 bytes per sample with tiered storage for archiving |
| Advanced Visualization | Rich, interactive dashboards | Slice and dice data without query language |
| Extreme Scalability | Native horizontal scaling | Parent-Child centralization with multi-million samples/s |
| Complete Visibility | From infrastructure to applications | Simplifies operations and eliminates silos |
| Edge-Based | Processing at your premises | Distributes code instead of centralizing data |
Note
Want to put Netdata to the test against Prometheus? Explore the full comparison.
This three-part architecture enables you to scale from single nodes to complex multi-cloud environments:
| Component | Description | License |
|---|---|---|
| Netdata Agent | • Core monitoring engine • Handles collection, storage, ML, alerts, exports • Runs on servers, cloud, K8s, IoT • Zero production impact |
GPL v3+ |
| Netdata Cloud | • Enterprise features • User management, RBAC, horizontal scaling • Centralized alerts • Free community tier • No metric storage centralization |
|
| Netdata UI | • Dashboards and visualizations • Free to use • Included in standard packages • Latest version via CDN |
NCUL1 |
With Netdata you can monitor all these components across platforms:
| Component | Linux | FreeBSD | macOS | Windows |
|---|---|---|---|---|
| System Resources CPU, Memory and system shared resources |
Full | Yes | Yes | Yes |
| Storage Disks, Mount points, Filesystems, RAID arrays |
Full | Yes | Yes | Yes |
| Network Network Interfaces, Protocols, Firewall, etc |
Full | Yes | Yes | Yes |
| Hardware & Sensors Fans, Temperatures, Controllers, GPUs, etc |
Full | Some | Some | Some |
| O/S Services Resources, Performance and Status |
Yessystemd |
- | - | - |
| Processes Resources, Performance, OOM, and more |
Yes | Yes | Yes | Yes |
| System and Application Logs | Yessystemd-journal |
- | - | YesWindows Event Log, ETW |
| Network Connections Live TCP and UDP sockets per PID |
Yes | - | - | - |
| Containers Docker/containerd, LXC/LXD, Kubernetes, etc |
Yes | - | - | - |
| VMs (from the host) KVM, qemu, libvirt, Proxmox, etc |
Yescgroups |
- | - | YesHyper-V |
| Synthetic Checks Test APIs, TCP ports, Ping, Certificates, etc |
Yes | Yes | Yes | Yes |
| Packaged Applications nginx, apache, postgres, redis, mongodb, and hundreds more |
Yes | Yes | Yes | Yes |
| Cloud Provider Infrastructure AWS, GCP, Azure, and more |
Yes | Yes | Yes | Yes |
| Custom Applications OpenMetrics, StatsD and soon OpenTelemetry |
Yes | Yes | Yes | Yes |
On Linux, you can continuously monitor all kernel features and hardware sensors for errors, including Intel/AMD/Nvidia GPUs, PCI AER, RAM EDAC, IPMI, S.M.A.R.T, Intel RAPL, NVMe, fans, power supplies, and voltage readings.
You can install Netdata on all major operating systems. To begin:
Choose your platform and follow the installation guide:
Note
You can access the Netdata UI at http://localhost:19999 (or http://NODE:19999 if remote).
Netdata auto-discovers most metrics, but you can manually configure some collectors:
You can use hundreds of built-in alerts and integrate with:
email, Slack, Telegram, PagerDuty, Discord, Microsoft Teams, and more.
Note
Email alerts work by default if there's a configured MTA.
You can centralize dashboards, alerts, and storage with Netdata Parents:
Note
You can use Netdata Parents for central dashboards, longer retention, and alert configuration.
Sign in to Netdata Cloud and connect your nodes for:
- Access from anywhere
- Horizontal scalability and multi-node dashboards
- UI configuration for alerts and data collection
- Role-based access control
- Free tier available
Note
Netdata Cloud is optional. Your data stays in your infrastructure.
See Netdata in action
FRANKFURT |
NEWYORK |
ATLANTA |
SANFRANCISCO |
TORONTO |
SINGAPORE |
BANGALORE
These demo clusters run with default configuration and show real monitoring data.
Choose the instance closest to you for the best performance.
With Netdata you can run a modular pipeline for metrics collection, processing, and visualization.
flowchart TB
  A[Netdata Agent]:::mainNode
  A1(Collect):::green --> A
  A2(Store):::green --> A
  A3(Learn):::green --> A
  A4(Detect):::green --> A
  A5(Check):::green --> A
  A6(Stream):::green --> A
  A7(Archive):::green --> A
  A8(Query):::green --> A
  A9(Score):::green --> A

  classDef green fill:#bbf3bb,stroke:#333,stroke-width:1px,color:#000
  classDef mainNode fill:#f0f0f0,stroke:#333,stroke-width:1px,color:#333
With each Agent you can:
- Collect – Gather metrics from systems, containers, apps, logs, APIs, and synthetic checks.
- Store – Save metrics to a high-efficiency, tiered time-series database.
- Learn – Train ML models per metric using recent behavior.
- Detect – Identify anomalies using trained ML models.
- Check – Evaluate metrics against pre-set or custom alert rules.
- Stream – Send metrics to Netdata Parents in real time.
- Archive – Export metrics to Prometheus, InfluxDB, OpenTSDB, Graphite, and others.
- Query – Access metrics via an API for dashboards or third-party tools.
- Score – Use a scoring engine to find patterns and correlations across metrics.
Note
Learn more: Netdata's architecture
With the Netdata Agent, you can use these core capabilities out-of-the-box:
| Capability | Description |
|---|---|
| Comprehensive Collection | • 800+ integrations • Systems, containers, VMs, hardware sensors • OpenMetrics, StatsD, and logs • OpenTelemetry support coming soon |
| Performance & Precision | • Per-second collection • Real-time visualization with 1-second latency • High-resolution metrics |
| Edge-Based ML | • ML models trained at the edge • Automatic anomaly detection per metric • Pattern recognition based on historical behavior |
| Advanced Log Management | • Direct systemd-journald and Windows Event Log integration • Process logs at the edge • Rich log visualization |
| Observability Pipeline | • Parent-Child relationships • Flexible centralization • Multi-level replication and retention |
| Automated Visualization | • NIDL data model • Auto-generated dashboards • No query language needed |
| Smart Alerting | • Pre-configured alerts • Multiple notification methods • Proactive detection |
| Low Maintenance | • Auto-detection • Zero-touch ML • Easy scalability • CI/CD friendly |
| Open & Extensible | • Modular architecture • Easy to customize • Integrates with existing tools |

Netdata actively supports and is a member of the Cloud Native Computing Foundation (CNCF).
It is one of the most starred projects in the CNCF landscape.
How to configure netdata
DISABLE_TELEMETRY=0Opts out of anonymous telemetry when set to non-zerovalues: 0 or 1
NETDATA_LISTENER_PORT=19999TCP port the Agent's web server and API listen onvalues: Any valid TCP port
NETDATA_HEALTHCHECK_TARGET=http://localhost:19999/api/v1/infoWhat the Docker health check pollsvalues: URL or 'cli'
DOCKER_USR=netdataSystem user the Agent runs asvalues: Valid system user
DOCKER_HOST=Auto-detectedLocation of the Docker daemon socketvalues: Docker socket path or proxy URL
netdata releases & version history
Release notes
Netdata v2.12.3 is a patch release to address issues discovered since v2.12.2.
This release makes the Agent detect a dead Netdata Cloud connection even while traffic keeps flowing, fixes use-after-free crashes when a stale node is removed while a child or plugin is still using it, stops children configured with parent using h2o from crashing on every connection, makes a negated IP in an access list take precedence over hostname matching, rejects malformed percent escapes in URLs, bounds MCP batch requests, removes global SQLite stalls, fixes crashes when obsolete charts are cleaned up while they are still being read, keeps the Agent from hanging at startup when a dbengine tier cannot be created, keeps Parents using the ram or alloc storage modes from shifting their children's history after a gap and from crashing on multi-node metric correlations, lets SNMP and other virtual nodes go offline again when their collector stops reporting them, makes PowerStore charts show the values the array reports instead of zeros, makes the eBPF plugins ignore directory overrides from the environment when they run with elevated privileges, and reloads host labels from the configuration file the Agent actually loaded.
Streaming and Netdata Cloud
- Fixed the MQTT keepalive of the Cloud connection. It was only checked when the connection was idle, so a link with steady inbound traffic never noticed an unanswered ping and could stay stalled indefinitely. The ping and acknowledgement deadlines also followed the wall clock, so a clock step caused a false ping timeout or delayed detection, and on boards without an RTC acknowledgements never timed out before the first NTP sync. Deadlines now use a monotonic clock, and a dead connection is detected 60 seconds after an unanswered ping (#24427, @stelfrag)
- The Agent's HTTPS client for Netdata Cloud now checks the chunk sizes of chunked responses strictly and caps such responses at 1 MiB. A malformed or very large chunk size could make the Agent exit while allocating memory for it (#24483, @stelfrag)
- Fixed use-after-free crashes when
netdatacli remove-stale-nodeor the orphan and ephemeral host cleanup removed a host that was still in use, either by a child reconnecting to it or by a plugin that had it selected as a virtual node. A child that reconnects during a removal is now asked to retry, and a virtual node selected by a plugin is reported as online and left alone (#24353, @stelfrag) - Removed the
[stream] parent using h2ooption. The h2o web server was removed in v2.7.0, and since v2.8.0 a child with this option enabled crashed on every connection attempt to its Parent. Astream.confthat still sets it is accepted and the option is ignored (#24426, @stelfrag)
Web server and APIs
- Access lists: a client whose IP matches a negated entry, such as
!203.0.113.7inallow connections from = !203.0.113.7 *, is now denied without its hostname being checked against the list. This applies to every access list innetdata.confwhen DNS checks are enabled, including the defaultheuristicmode for lists with a wildcard (#24404, @ArjunD3456) - URLs with malformed percent escapes are now rejected with HTTP 400. A
%had to be followed by two hex digits but was not checked, and a URL that failed to decode was served using the part decoded so far, so/api/v1/info%zzwas answered as/api/v1/info. A request containing a literal%that is not followed by two hex digits, such as?x=100%, now gets 400 (#24248, @stelfrag) - The MCP API key and the management API key are now compared in constant time, so response timing no longer reveals how close a guessed key is (#24418, @ArjunD3456)
- MCP: JSON-RPC batches are limited to 64 requests and 16 MiB of responses, and WebSocket messages to 1 MiB, the same as HTTP requests. Requests whose id is not a string, number or null are rejected (#24425, @stelfrag)
X-Forwarded-For: the Agent now keeps only the first address of the header, and only when it is a valid IPv4 or IPv6 address. This is the forwarded client address shown in the access log and in the audit entries of dynamic configuration changes. Other values, such asunknown, are dropped (#24452, @ArjunD3456)- Registry: the
netdata_registry_ididentity is now read only from theCookieheader, not from anywhere else in the request, such as the query string. This affects only Agents with the registry enabled, which is off by default (#24494, @ArjunD3456) - Claiming: a request to
/api/v2/claimor/api/v3/claimwith a wrong key no longer regenerates the claim challenge, so it cannot interrupt a claim an administrator is making. The challenge is still regenerated at startup and after a claim with a valid key (#24531, @stelfrag)
Database
-
Fixed SQLite stalls across the Agent. A global lock was held around SQLite calls, so one slow statement blocked every thread using SQLite, not only those using the same database connection (#24099, @stelfrag)
-
Corruption of the metadata database that appears while the Agent is running is now marked for recovery on the first failing query, instead of only at a clean shutdown or never after a crash. The SQLite query statistics no longer count a busy retry that later succeeded as a failed query (#24225, @stelfrag)
-
Parents using the
ramorallocstorage modes no longer shift their children's streamed and replicated history after a gap. Every gap moved all older values one interval earlier and overstated retention by one interval (#24434, @stelfrag) -
dbenginenow loads only datafiles with the exact name it writes. A copy such asdatafile-1-0000000001.ndf.bakwas loaded a second time alongside the real file, and a straydatafile-2-*.ndfstopped the Agent at startup. Other names are now reported as unknown files and skipped (#24436, @stelfrag) -
Fixed crashes when the cleanup of obsolete charts freed a chart, or its labels, while health variable lookups, Prometheus export, alert and context API requests or queries were still reading it. These include the Agent exiting on an allocation of a huge size (#24466, #24474, @stelfrag)
-
dbengine: the Agent no longer hangs at startup when the directory of a tier cannot be created or its initialization thread cannot start. A missing tier above tier 0 now leaves the Agent running with the tiers below it, and a missing tier 0 stops startup with an error (#24435, @stelfrag)
Queries
- Fixed a crash in metric correlations and other weights queries over two or more nodes on Agents without a
dbenginetier, such as a Parent using theramorallocstorage modes. Such Agents now process the nodes one at a time (#24433, @stelfrag) - The
summary.nodes[]section of query responses now includes the query time of the last node, which was missing. Withoptions=percentage, the anomaly rate of the dimensions view is no longer inflated. Thechart_labelsarrays of/api/v1/datanow have one entry per dimension, withnullwhere a chart lacks the label (#24460, #24474, @stelfrag)
Machine learning
[ml] dimension anomaly score thresholdis now limited to 0.01 to 1.00, with a warning in the log when the configured value is changed. Values up to 5.00 were accepted, but anything above 1.00 silently turned off anomaly detection, because a model's anomaly score cannot exceed 100. Such values now run at 1.00, the least sensitive setting (#24499, @stelfrag)
Collectors
ebpf.pluginandebpf-go.pluginare installed setuid root. When they run with elevated privileges, they now ignore theNETDATA_*_DIRenvironment variables and use the plugin, configuration and log directories they were built with. Standard installations are not affected. A[directories]override innetdata.confthat points these directories elsewhere no longer reaches the eBPF plugins, which log one line for each ignored variable (#24412, @stelfrag)- Redfish: manager network ports exposed as standard Port resources are now collected, including their link state and speed. They were rejected, leaving the collection permanently partial (#24270, @ilyam8)
- PAN-OS:
panos.ipsec.tunnelsnow counts the established IPsec tunnels instead of reporting the configured ones, and a tunnel with overlapping SAs during rekeying counts once. The remaining SA lifetime now reports the longest valid lifetime of a tunnel instead of a varying or summed value (#24385, @macmandr197) go.d.plugin: fixed collectors such as Cato Networks failing a collection cycle with a host scope conflict when a host's metadata changed while its identity stayed the same (#24415, @ktsaou)- Cato Networks: the topology Function now connects each site to its devices, keeps every observed WAN tunnel instead of merging parallel ones, and marks tunnels as connected, disconnected or unknown. Sites, devices and tunnels carry more detail for troubleshooting, such as HA roles, loss, jitter, last-mile measurements and BGP sessions, and the graph notes when inventory, metrics or BGP data are missing. The collector now uses Cato SDK v1.1.0 (#24413, @ktsaou, #24362, @ilyam8)
ebpf.plugin: the number of tracked PIDs inebpf.monitoring_pidno longer keeps growing on hosts with short-lived processes. A process that exited before its/procentry was read was released without being subtracted (#24423, @stelfrag)statsd.plugin: with[statsd] set charts as obsolete afterenabled (off by default), the Agent no longer crashes the first time an idle metric is removed. Removal also no longer leaks the metric's values, and metrics used by synthetic charts are kept. The private chart count no longer wraps around and blocks every new private chart (#24440, @stelfrag)- Virtual nodes: the inactivity timeout set by a collector, such as the one SNMP devices use, works again. It was discarded when the node was defined, so a virtual node never went offline after its collector stopped reporting it. A virtual node taken over again by its local collector after a streamed copy of it stops now has its health checks and normal operation restored (#24495, @ilyam8)
- SNMP: a poll in which the device answered no request now fails. Profile statistics built from cached metadata were still reported for the device's virtual node, keeping it active after its measurements had stopped (#24497, @ilyam8)
- PowerStore: performance, Ethernet and capacity charts now show the values the array reports. The collector read the field names of raw samples, while the five-minute and daily rollups it requests use different names, so these charts showed zeros or were missing. CPU now shows the peak utilization of the interval as a percentage, and average login counts keep their fractions (#24448, @ilyam8)
log2journal: JSON lines that end inside a backslash escape are now rejected instead of being parsed with bytes from beyond the end of the line (#24365, @ArjunD3456)log2journal: a named group of a PCRE2 pattern or rewrite rule that does not take part in a match, such as an optional group, no longer makes the parser read one byte before its buffer. Output does not change (#24380, @ArjunD3456)log2journal: fixed several JSON parsing and output issues. Very long numbers with an exponent could overflow the number buffer or crash the process,\u000aand\u0009escapes dropped the rest of the value, unpaired surrogates produced invalid UTF-8, and a line that failed to parse left its fields to the next line in both JSON and logfmt mode. An--injectnow replaces a value read from the log instead of being appended to it, and a rewrite that refers to its own key reads the original value (#24443, @stelfrag)go.d.plugin: fixed two shutdown races in the job manager. A shutdown or failed restart could wait until its deadline instead of finishing, and a Function request that had already been accepted could be reported as rejected because the plugin was stopping (#24491, @ilyam8)go.d.pluginservice discovery: discovered names and addresses are now encoded as data in the jobs that discovery rules generate. They were inserted into the YAML as text, so an IPv6 address could make a job fail to parse and a name such asonbecame a boolean. Stock rules use a newjobtemplate helper, for example{{ job "name" .Name "url" .Address }}, which custom rules can use too. Existing rules and saved dynamic configurations keep working (#24469, @ilyam8)go.d.plugin: collector logs and errors, including those returned by dynamic configuration checks, no longer include raw content from the files a collector reads, such as log samples, configuration lines or certificates. They name the file, line, field and reason instead, so some messages are less detailed (#24496, @ilyam8)go.d.pluginandibm.d.plugin: HTTP responses read by collectors, including Prometheus and OpenMetrics endpoints, are now limited to 64 MiB, measured after gzip decompression. A larger response fails the collection instead of growing memory without bound. HTTPCheck reports such a response asbad_content; use a smaller endpoint for health checks (#24490, @ilyam8)- SNMP traps and S3: the state files these collectors keep are now read and written safely. Symlinks and special files are rejected, and a temporary file left by a crash no longer blocks later writes (#24462, @ilyam8)
- Fixed stock alert and metadata issues: the Portcheck
portcheck_connection_failsalert no longer looks up a dimension that does not exist, the Elasticsearch, OpenSearch and Unbound metadata now match the charts they describe, and the Unbound and ethtool module charts are titled "Module ..." again instead of "CollectorV1 ..." (#24308, @ilyam8)
Functions
- The progress Function now shows API calls that failed with a server error as errors. They were styled with a severity the dashboard does not recognize and looked like successful calls (#24185, @ilyam8)
Agent
- Host labels are now read from the configuration file the Agent loaded, including one given with
-c, at startup and onnetdatacli reload-labels. Labels removed from that file are also removed on reload (#24117, @stelfrag) - Crash reports now include a stack trace for
SIGABRTraised outside the Agent's own fatal error handling (#24094, @stelfrag) - On macOS and Linux builds without libbacktrace, the Agent again saves its status file when it crashes, so the next start reports the exit reason and signal (#24345, @stelfrag)
- Fixed a use-after-free at shutdown on Parents with archived children, when loading their contexts outlasted the shutdown wait (#24492, @stelfrag)
- Fixed rate-limited log messages being emitted more often than their limit when several threads logged through the same limiter at once (#24249, @stelfrag)
- When
[db] update everyis above 3600, the warning now reports the value it was clamped to (3600) instead of 1. The clamp itself was already correct (#24378, @stelfrag) - When a collector tries to add a dimension without an id, the fatal error now says so, instead of blaming the destruction of the chart's dimension index (#24528, @stelfrag)
Installation and packaging
- The installer and updater now treat curl exit status 56, which some curl versions return on protocol errors, as a download failure, like exit statuses 22 and 78 (#24276, @Ferroin)
- Windows packages now include updated MSYS2 packages on top of the bundled MSYS2 base, including OpenSSL 3.6.5, curl 8.23.0 and msys2-runtime 3.6.11. Each update is pinned by URL and checksum, and the bundled package database matches the files that ship (#24473, @stelfrag)
- When building from source needs a Go toolchain and none is installed, the installer now downloads Go 1.27.3 instead of 1.27.0. Go 1.27.0 and later remain supported (#24411, @ilyam8)
Acknowledgments
We would like to thank our dedicated, talented contributors that make up this amazing community. The time and expertise
that you volunteer is essential to our success.
- @ArjunD3456 for making negated IPs in access lists take precedence over hostname matching, for comparing the MCP
and management API keys in constant time, for stoppinglog2journalfrom reading past its buffers on JSON escapes and unmatched PCRE2 groups, and for tightening
how theX-Forwarded-Forheader and the registry cookie are read. - @macmandr197 for correcting the PAN-OS IPsec tunnel counts and rekey lifetimes.
Support options
As we grow, we stay committed to providing the best support ever seen from an open-source solution. Should you encounter an issue with any of the changes made in this release or any feature in the Netdata Agent, feel free to contact us through one of the following channels:
- Netdata Learn: Find documentation, guides, and reference material for monitoring and troubleshooting your systems with Netdata.
- GitHub Issues: Make use of the Netdata repository to report bugs or open a new feature request.
- GitHub Discussions: Join the conversation around the Netdata development process and be a part of it.
- Community Forums: Visit the Community Forums and contribute to the collaborative knowledge base.
- Discord Server: Jump into the Netdata Discord and hang out with like-minded sysadmins, DevOps, SREs, and other troubleshooters. More than 2000 engineers are already using it!
Netdata v2.12.2 is a patch release to address issues discovered since v2.12.1.
This release tightens SNMPv3 authentication in the SNMP traps receiver, stops alert evaluation from keeping obsolete charts alive indefinitely, makes Cloud reliably see disconnected children as offline and receive every alert transition, restores the intended backoff when the Agent reconnects to Cloud, requires Function and dynamic configuration requests to carry strict JSON, keeps external plugins running after a single malformed line of output, keeps Kubernetes state charts and their alerts from disappearing when a similarly named object is deleted, makes long-range queries return data from newer tiers after a gap in older ones, and fixes static 64-bit ARM builds that could crash at startup on Cortex-A53 boards such as the Raspberry Pi 3.
Streaming and Netdata Cloud
- Fixed a race where a child that disconnected from its Parent could stay live in Netdata Cloud. The node state update was scheduled before the child was marked offline, so under CPU contention the offline state was sometimes never sent (#24285, @stelfrag)
- A Parent now waits 125% of a disconnected child's expected reboot time, capped at 30 seconds, before reporting it offline to Netdata Cloud. Integer arithmetic had reduced the margin to 100%. A child with no recorded reboot time no longer schedules a zero-delay timer, which can cause high CPU usage with older libuv versions (#24343, @stelfrag)
- Fixed alert transitions being lost on the way to Netdata Cloud. A message the MQTT layer refused, for example while offline or with a full buffer, was treated as delivered and removed from the queue; it is now retried. The alert snapshot also could announce more chunks than it sent, and is now built from a single consistent query and sent only after a successful rebuild (#24224, @stelfrag)
- Fixed the reconnect backoff to Netdata Cloud. Once the backoff reached its cap, the clamp was returned in seconds but slept as milliseconds, so a disconnected Agent retried about once per second instead of waiting up to the intended maximum (currently 20 minutes) (#24340, @stelfrag)
- Fixed the Cloud connection handing out MQTT packet id 1 twice when the packet id counter wrapped around. Two messages in flight with the same id lose their acknowledgement and timeout tracking (#24341, @stelfrag)
- Fixed the
t-rxtimestamp in the Agent's HTTP replies to Netdata Cloud, which had been sent as 0 since v2.0.0 instead of the time the request was received (#24252, @stelfrag)
Health
- Fixed alert evaluation keeping obsolete charts alive. Every evaluation pass refreshed the chart's last-access time, so an obsolete chart with an alert attached was never old enough to be cleaned up. On Kubernetes nodes with pod churn this kept growing the number of
k8s.cgroupcharts, and the metadata on Parents along with it (#24273, @stelfrag) - Fixed several health persistence bugs: a prepared statement leaked on every alert transition on hosts without an ACLK configuration, 64-bit event ids were bound as 32-bit values, and the next alarm event id fell back to 0 instead of the alarm id when there were no detail rows (#24223, @stelfrag)
Database
- Fixed metadata cleanup passes that could stall. A dimension, chart or label cleanup pass never completed if the first row of its snapshot was deleted before being read, and an interrupted context cleanup dropped the context from its queue, leaving the rest of its dimensions unchecked. Failed chart label stores are now retried, and the WAL size is checked far less often during cleanup (#24227, @stelfrag)
- Fixed a deadlock when freeing a dictionary whose delete callback destroys a nested dictionary that still has referenced items. Tier backfill could reach it when a chart of a removed host was freed while one of its dimensions was still referenced (#24344, @stelfrag)
dbengine: corrupted gorilla-compressed pages whose length is not a multiple of the buffer size are now rejected instead of being read past the end of their allocation (#24310, @ArjunD3456)- Fixed completed points of higher tiers staying invisible to queries for a full extra tier period. They were published only when a collection landed exactly on a tier boundary, which slow or offset collectors can miss every time; overdue points are now published on the next collected sample (#24405, @ktsaou)
dbengine: gaps of a single second are now cached like longer ones, so repeated queries over them no longer search the journals again, and a cached gap no longer overlaps the first point of the page that follows it (#24370, @ktsaou)
Queries
- Fixed the
dimensions=filter of/api/v1/contextand/api/v1/contexts, which ignored every metric whose name equals its id (most of them) and so returned all dimensions, instances and contexts (#24245, @stelfrag) - Fixed
instance@node_idpatterns in the weights API (metric correlations, anomaly rates), which matched nothing (#24245, @stelfrag) - Fixed label filters that combine a bare label name with a
name=valueterm, so matching charts are kept while negativename=valueterms still take precedence (#24202, @stelfrag) - Fixed
/api/v1/inforeading the analytics strings (build info, release channel, notification methods, exporting connectors) without their lock, so a request that overlapped an analytics refresh could read freed memory (#24342, @stelfrag) - Fixed queries returning empty rows for the rest of their time range when an older tier ran out of data well before the planned switch to a newer tier. The query now continues into the newer tier, and SES/DES no longer extend stale values to the end of a query whose tier switch failed (#24406, @ktsaou)
Functions
- Function and dynamic configuration requests now accept only strict JSON request bodies (RFC 8259). Any other body, such as YAML, form data or plain text, is rejected with HTTP 400. The dashboard, Netdata Cloud and the Agent's own callers already send JSON. A saved dynamic configuration that is not strict JSON fails to re-apply, with a warning in the log. Bodies are checked again where they are passed to plugins and streaming children, so update Parents as well as their children (#24409, @ktsaou)
go.d.plugin: the body of a Function request is now treated as data up to its end marker. A line in the body that looked like a plugin command could replace the running Function call, cancel another one, or stop the plugin from reading further requests. Malformed or oversized requests are now skipped as a whole, without their bodies being parsed as commands (#24410, @ilyam8)
Collectors
- External plugins: a protocol error, such as a single corrupted line of plugin output, permanently disabled the plugin until the Agent restarted. Protocol errors now follow the same policy as error exits: the plugin is restarted after 10 ×
update_everyseconds, and disabled only if it never produced useful output or fails more than 10 consecutive runs (#24051, @ilyam8) - SNMP traps: SNMPv3 messages are now rejected and counted as
usm_failureswhen they skip authentication for a user configured to require it, or declare a non-USM security model. Rejected messages are not acknowledged and do not register engine IDs (#24188, @ilyam8) - SNMP: community strings and SNMPv3 passphrases are no longer included in the connection details written to debug logs (#24217, @ilyam8)
- Disk statistics: fixed detection of the discard and flush fields in
/proc/diskstats. Kernels before 4.18 got sixdisk_ext.*charts of zeros, and kernels 4.18 to 5.4 gotflushesdimensions stuck at zero. The fields are now detected per disk, andflushesdimensions are added when a disk starts reporting them (#24243, @stelfrag) proc.plugin: reduced overhead on kernels where some/procfiles are not seekable, such as Ubuntu 24.04 HWE (6.14). Rewinding such a file no longer resolves its name again on every read, cuttingproc.pluginbusy time by about 9% (#24212, @stelfrag)- Kubernetes state: deleting a node, pod, deployment or cronjob no longer removes the charts of live objects whose names start with the same name, such as pods
web-10toweb-19whenweb-1is deleted. Those charts did not come back until the object was recreated or the Agent restarted, and their alerts, such ask8s_state_deployment_condition_available, silently stopped. Scheduling a pod also no longer rewrites the node label on such charts (#24402, @stelfrag) log2journal: JSON input with arrays nested deeper than the parser's maximum depth is now rejected with an error instead of overrunning its key stack (#24290, @ArjunD3456)
Installation and packaging
- Static builds for 64-bit ARM now enable the linker workarounds for Cortex-A53 errata 835769 and 843419, including for the Rust plugins. Depending on code layout, a static build could die with
SIGILLat startup on Cortex-A53 boards such as the Raspberry Pi 3 and ODROID-C2. CI now scans the aarch64 static archive for unfixed instruction sequences, and Rust functions are aligned to 8 bytes so the linker's erratum stubs cannot shift them back onto an affected sequence (#24207, @stelfrag, #24387, @vkalintiris) - Windows packages now bundle the
msys-2.0.dllfrom MSYS2's ownmsys2-runtime3.6.11 package, pinned by URL and checksum, instead of building a patched 3.6.10 runtime from source. 3.6.11 carries the upstream fixes for the startup crash addressed in v2.12.1, and the source build no longer compiled with MSYS2's current toolchain (#24390, @stelfrag) - Updated the vendored IBM MQ client libraries to 9.4.5.1 (#24294, @Ferroin)
Acknowledgments
We would like to thank our dedicated, talented contributors that make up this amazing community. The time and expertise
that you volunteer is essential to our success.
- @ArjunD3456 for bounding the array nesting depth of the
log2journalJSON parser and
for rejecting corrupted gorilla pages indbengine.
Support options
As we grow, we stay committed to providing the best support ever seen from an open-source solution. Should you encounter an issue with any of the changes made in this release or any feature in the Netdata Agent, feel free to contact us through one of the following channels:
- Netdata Learn: Find documentation, guides, and reference material for monitoring and troubleshooting your systems with Netdata.
- GitHub Issues: Make use of the Netdata repository to report bugs or open a new feature request.
- GitHub Discussions: Join the conversation around the Netdata development process and be a part of it.
- Community Forums: Visit the Community Forums and contribute to the collaborative knowledge base.
- Discord Server: Jump into the Netdata Discord and hang out with like-minded sysadmins, DevOps, SREs, and other troubleshooters. More than 2000 engineers are already using it!
Netdata v2.12.1 is a patch release to address issues discovered since v2.12.0.
This release fixes a startup crash and a timezone detection bug in the Windows Agent, stabilizes the eBPF collector across a wider range of kernels and libbpf versions, reduces the load the Docker collector places on the Docker daemon, and removes unnecessary work from dbengine datafile deletion on busy Parents.
Windows
- Fixed the Windows Agent crashing at startup with an access violation inside
msys-2.0.dll. The bundled MSYS2 runtime carried an incomplete backport of an upstream Cygwin change; packages now ship a runtime rebuilt with the missing upstream fixes, the MSYS2 installer is pinned by tag and checksum, and packaging fails if the expected runtime is not the one shipped (#24170, @stelfrag) - Fixed Windows timezone detection reporting garbage, or reading past its buffer, when the Windows timezone had no match in the IANA mapping. The mapping is now parsed by attribute with bounded copies, the user's region is preferred over the world default as intended, and on failure the existing timezone is kept (#24101, @stelfrag)
eBPF collector
- Synced the eBPF collector with
ebpf-co-rev1.7.0.3 andkernel-collectorv1.7.0.4, reworking the disk and process probes for better kernel compatibility, including hosts without BTF (#24008, @thiagoftsm) - Fixed
ebpf.pluginaborting with heap corruption on hosts where the number of possible CPUs exceeds the number of online CPUs, such as VMware guests (#24008, @thiagoftsm) - Fixed a crash when an eBPF object or BTF data could not be loaded on builds with older libbpf versions (#24008, @thiagoftsm)
- Fixed
ebpf.pluginrunning the wrong action for most command-line options, so options such as--unittestnow do what they say (#24008, @thiagoftsm)
Database
- Removed a scan of the open cache that ran on every dbengine datafile deletion only to feed a debug check compiled out of release builds. The scan walked the whole clean queue under its lock, which can be large on busy Parents (#24162, @stelfrag)
Collectors
- Docker: reduced the CPU load the collector causes in
dockerdandcontainerd, which was significant on Docker Engine 29+ with the containerd image store. The image list is now refreshed at most once every 5 minutes, and the module's defaultupdate_everyis raised from 1 to 10 seconds (#24146, @ilyam8) - Docker: fixed image usage metrics on daemons that negotiate an API older than 1.51, where every image was counted as active and dangling images were always reported as 0. Usage is now derived from the container list on every collection (#24147, @ilyam8)
- Redfish: the configuration form now shows the username and password only for the authentication methods that use them (#24106, @ilyam8)
- Redfish: fixed the collector permanently skipping resources whose
@odata.iddiffers from the URI they were fetched from, such as the trailing-slash variants and remapped NetworkAdapters and Storage paths returned by HPE iLO. Affected jobs stayed in apartialstate with a standingredfish_collection_statuswarning. Same-origin aliases are now accepted, the other URI safety checks still apply, and rejections report the specific reason (#24186, @ilyam8) - Ceph: removed a stray option selector from the configuration form, and stopped the Redfish TLS settings from rendering a duplicate tab strip (#24108, @ilyam8)
- SMBIOS Memory: the collector is now built only on Linux, the only platform that exports the SMBIOS tables it reads. On macOS, FreeBSD and Windows its stock job used to start and fail with
read SMBIOS entry point: ... no such file or directory(#24169, @ilyam8)
Support options
As we grow, we stay committed to providing the best support ever seen from an open-source solution. Should you encounter an issue with any of the changes made in this release or any feature in the Netdata Agent, feel free to contact us through one of the following channels:
- Netdata Learn: Find documentation, guides, and reference material for monitoring and troubleshooting your systems with Netdata.
- GitHub Issues: Make use of the Netdata repository to report bugs or open a new feature request.
- GitHub Discussions: Join the conversation around the Netdata development process and be a part of it.
- Community Forums: Visit the Community Forums and contribute to the collaborative knowledge base.
- Discord Server: Jump into the Netdata Discord and hang out with like-minded sysadmins, DevOps, SREs, and other troubleshooters. More than 2000 engineers are already using it!
AI summary Added OpenTelemetry Traces and Redfish hardware monitoring
NOTICE
The v2.12.0 build of the Netdata Agent for Windows has been discovered to have serious stability issues that cause it to crash randomly on startup due to an upstream bug in some of the tooling we depend on. As such, we have removed the installer for it from the release page. A fix is expected in v2.12.1, but until that release, users are encouraged to use the latest known working version (v2.11.1), which can be downloaded here.
Table of Contents
- Summary
- Highlights
- OpenTelemetry Traces, in Early Access
- Redfish: Out-of-Band Server Hardware Monitoring
- SNMP Topology: Diagnostics, Offline Triage and Replay
- New Collectors: S3 Object Storage and SMBIOS Memory
- Ceph, Reworked as a Prometheus Complement
- Windows: Hyper-V, RDP and Broader Coverage
- Secrets and Privilege Hardening in go.d
- Query Engine: Correctness and Faster Weights
- Agent Stability: dbengine, SQLite, ACLK and ML
- Netdata Cloud: Infrastructure Knowledge, Node Decommissioning and AI Conversations
- Platform Support Changes
- Acknowledgments
- Contributions
- Deprecation notice
- Support options
Release Summary
v2.11.0 brought network topology and made logs a first-class signal next to metrics. v2.12.0 adds OpenTelemetry
traces, out-of-band hardware monitoring through Redfish, and a diagnostics layer that makes SNMP topology debuggable,
alongside a large round of collector, query and stability fixes.
The third observability signal arrives. Netdata already ingested OpenTelemetry metrics and logs. This release adds
traces: OTLP trace records are received, normalized and stored by the agent under their own retention policy, with a
purpose-built columnar store — trace-aware indexes, bloom filters and rollups — and an otel-traces query Function that
searches traces, aggregates them over a window and drives an overview heatmap. You explore them in a new Traces tab
of the dashboard, available today as an Early Access feature.
Hardware monitoring goes out-of-band. The new Redfish collector talks to the BMC — iDRAC, iLO and any
DMTF Redfish implementation — rather than to the operating system, so as long as the BMC stays powered and reachable it
keeps reporting fans, temperatures, power supplies, drives and controllers when the host itself is unhealthy, rebooting or
powered down. It ships with sensor and hardware
inventory Functions, independent per-sensor threshold health, and an on-demand BMC log viewer. Alongside it,
SMBIOS Memory compares the firmware's per-slot memory inventory with an accepted baseline and raises an alert when a
recorded DIMM goes missing or comes back smaller — memory loss that a total-RAM figure alone does not pin to a slot.
The network work from v2.11.0 becomes operable. The SNMP topology engine gained an entire diagnostics layer: every
walk records its timing, its profile decisions and its failures; the evidence is retained in bounded form, published
independently of whether topology collection succeeded, packaged into a portable archive, and folded into the agent's
support bundle. A topology graph can then be replayed hermetically from that archive and inspected offline, which turns
"SNMP topology is not seeing this switch" from a site visit into a file you can send us. LLDP-V2 for PAN-OS, Meraki L2,
IpAddressTable support and a set of reusable topology-role profiles widen what the engine can see in the first place.
In Netdata Cloud, Netdata AI learns your infrastructure. With Infrastructure Knowledge, your team writes down
what only it knows — which services matter, what is expected, what normal looks like — and Netdata AI remembers facts
you tell it in conversation, then reads both before every conversation, investigation and report. AI conversations now
survive a closed tab and no longer fail when they grow long, and nodes being retired can be decommissioned so they
stop sending notifications.
And a lot of the release is consolidation. The Ceph collector was rebuilt as a complement to the Prometheus
collector and migrated to the v2 collector framework, with alert coverage and Tentacle support. go.d's secret handling
was systematically de-privileged: file and command secret providers now run without elevated privileges and through
nd-run, and secret references in auto-discovered jobs are no longer resolved unless the discovery pipeline is
explicitly trusted. Dynamic Configuration now reports an accepted go.d change separately from whether the job,
discovery pipeline or secret store has started, so clients should check configuration status for the outcome. Six independent correctness fixes landed in the query engine, and a long run of dbengine, SQLite,
dictionary, ACLK and ML fixes closes out crashes and leaks — many of them already shipped to users in the 2.11.1 patch
release and consolidated here.
Release Highlights
OpenTelemetry Traces, in Early Access
The agent's OTLP receiver now accepts traces in addition to metrics and logs, and a new Traces tab in the
dashboard lets you explore them.
Trace records arriving on the OTLP/gRPC endpoint are normalized, written to the write-ahead log and sealed
into the same columnar store that serves logs, extended for spans: span-extras columns, a trace-aware row index, trace
bloom filters, span combination and trace rollups. Queries are served by a new otel-traces Function, which exposes
capability discovery plus a trace search that filters on span fields and breaks each trace's spans down by service, a
window aggregate embedded in the search response, and an overview heatmap that follows the page's current selections.
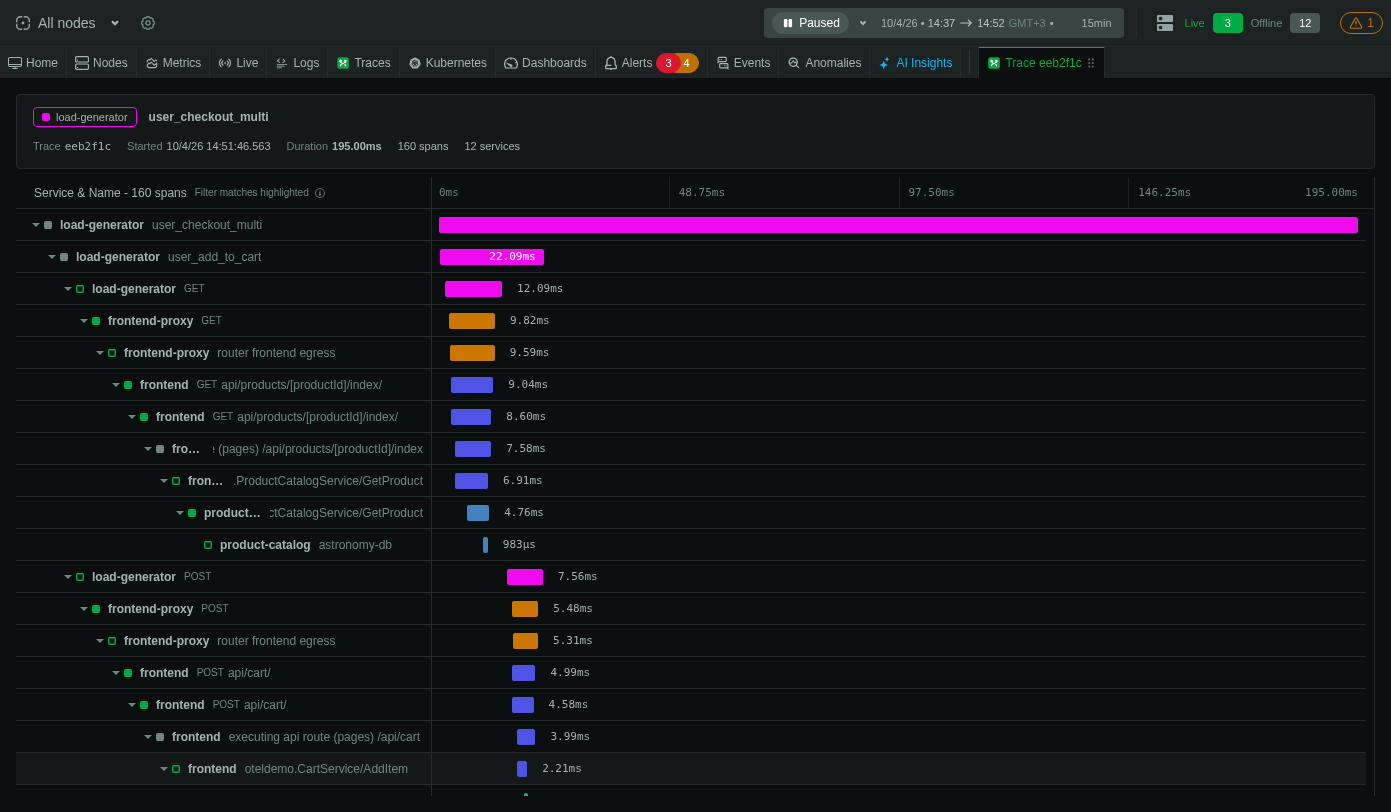
Seeing your traces. Pick a time window and the Traces tab shows you where the time goes: a heatmap of trace
durations, the traces themselves with the services each one touched and any errors along the way, and filters to narrow
things down by service, span name or minimum duration. Click a trace to see its spans laid out as a waterfall, then
click a span for its attributes, resource, scope, events and links. You'll find Traces under Explore in a room, and
right next to Logs on a node's page.
Note
Traces is still in Early Access, so it stays hidden until you switch it on: click Early Access in the sidebar
and flip the Traces toggle (your browser remembers the choice). Just like logs, you'll need to be signed in to
Netdata Cloud, with access to the node's Space, to see them.
Traces are stored under their own retention settings — the traces section of otel.yaml takes the same rotation and
retention options as logs. With remote storage enabled, trace files that local retention has already removed are read
back from object storage for queries, as log files are, through a download cache that both signals now share at
{base_dir}/remote-read. A remote file that cannot be downloaded marks the answer as partial (remote_unavailable),
while a query that needs more remote data than the cache can hold fails with a request to narrow the range or raise
remote_storage.read_cache_max_size. Offloaded files are downloaded whole and one at a time, so the first query over
offloaded history can be slow, and a lookup of one trace by ID without a time range searches everything kept, local and
offloaded, so it fails once the offloaded history is larger than the cache.
Related work hardened the plugin around it: the otel-plugin now binds its gRPC endpoint before declaring its
Functions. On a port conflict it exits once without advertising a receiver it cannot listen on, and the agent disables
it until the next agent restart instead of restarting it in a loop. The OpenTelemetry documentation gained a
known-errors section covering exactly that case.
(#23479, #23738,
#23739, #23826,
#23905, #24088)
Redfish: Out-of-Band Server Hardware Monitoring
The new go.d/redfish collector monitors server hardware through the DMTF Redfish API of a baseboard management
controller. Because it queries the BMC rather than the operating system, it keeps reporting while the host is
unresponsive, mid-reboot or powered off, as long as the BMC itself stays powered and reachable — which is precisely when
hardware questions get asked.
One job per BMC covers the chassis and system inventory: thermal sensors and fans, power supplies and consumption,
processors and memory, storage controllers and drives, and the overall health roll-up.
Beyond charts, it ships operator tooling:
- Sensor and hardware Functions — on-demand tables of the full sensor set and the hardware inventory, with enriched
detail (models, part and serial numbers, firmware revisions). - Independent sensor threshold health — each sensor's own upper and lower thresholds, as reported by the BMC, drive
its health state, rather than a single collector-wide rule. - An on-demand BMC log viewer — the controller's own event log, read through the same Function mechanism, without
logging in to the BMC's web interface.
(#23343, #23909,
#23912, #23915,
#23922, #23926,
#23929, #23933,
#23938, #23943,
#23949, #23950,
#23957, #23962)
SNMP Topology: Diagnostics, Offline Triage and Replay
The SNMP topology engine shipped in v2.11.0 as a technical preview. This release gives it the thing a network discovery
engine needs most: an account of what it did and why.
Every acquisition is now explained. Per-walk timing and preparation diagnostics, the profile context that was
selected and the failure details behind each miss, plus the topology source and processing decisions, are all recorded.
Crucially, diagnostics are published independently of topology collection — when the walk fails outright, the
diagnostics still arrive, which is the case that previously produced silence.
The evidence is bounded and retained. Diagnostic evidence is kept within a fixed budget, topology history is
retained alongside it, and per-device diagnostics recur on a schedule rather than only on the first failure.
It travels. Diagnostics are packaged into a portable archive, integrated into the agent's support bundle, and can be
inspected directly from a support bundle. A dedicated archive diagnostic tool and offline inspection mode read an archive
without touching the network, and hermetic topology graph replay rebuilds the graph from recorded input so the same
inputs always produce the same graph — which makes a topology bug reproducible off-site.
Coverage grew as well: LLDP-V2 topology for PAN-OS, a Meraki products L2 profile, IpAddressTable support, UniFi
topology profiles, and a set of reusable topology-role profiles (classic bridge, qbridge, STP, L3 neighbor) built on
standard-MIB building blocks. SNMP profiles went from 272 to 286. A run of correctness fixes made FDB-inferred
topology reliable by default, validated and decoded LLDP management addresses properly, selected usable management IPs,
rejected ambiguous FDB alias owners, and corrected device metadata and discovery counts.
(#23665, #23667,
#23670, #23675,
#23680, #23682,
#23709, #23717,
#23723, #23753,
#23791, #23794,
#23797, #23798,
#23800, #23806,
#23808, #23821,
#23827)
New Collectors: S3 Object Storage and SMBIOS Memory
S3 Compatible Object Storage (go.d/s3check) monitors object storage the way users experience it, with active
checks rather than server-side statistics. Each job runs one of three modes. In lifecycle mode it writes a small probe
object, reads it back and verifies its content, confirms it is listed, deletes it and confirms it is gone, timing every
step — so availability and latency are measured end to end against AWS S3, Ceph RGW or any S3-compatible endpoint. Both
replication modes write at the source and check propagation at the destination across collection cycles:
ceph_multisite measures when the object appears there and later stops being served, and aws_replication measures
propagation of the new object version and then of its delete marker in versioned buckets — turning replication lag into
a measured number instead of an assumption.
SMBIOS Memory (go.d/smbios_memory) reads the physical memory inventory that the firmware publishes through SMBIOS
— every memory device, its size, type, speed, manufacturer and locator — and compares it against an accepted baseline. A
slot is identified by its bank and device locator together, so boards that reuse names like "DIMM 0" in every bank are
compared correctly. When a DIMM stops being reported, or reappears smaller than it was, the collector raises a
memory-loss alert, and its Memory Inventory Function identifies the affected slot — a change that otherwise tends to go
unnoticed until capacity planning does. Because SMBIOS is boot-time firmware data, this reports an inventory change
rather than a live DIMM fault or a measurement of usable RAM.
(#23669, #23731,
#23965, #24043)
Ceph, Reworked as a Prometheus Complement
Ceph monitoring was reworked from a standalone collector into a complement to the Prometheus collector. Ceph already
exposes a comprehensive Prometheus endpoint through its manager module; rather than re-implementing that surface, a stock
Prometheus profile now covers it, while go.d/ceph keeps querying the Ceph Dashboard API for what the endpoint does
not provide, including on-demand Functions for health checks, OSD and daemon inventory, and pool policy.
Alongside the rework, the collector was migrated to the go.d framework v2, gained first-phase monitoring and stock
alert coverage, had its profile charts ordered by operator priority, and picked up support for Ceph Tentacle
hardware and PG rebuild metrics. Documentation examples and Prometheus expiry guidance were corrected to match.
More broadly, the Prometheus collector's stock profile coverage is now published as generated documentation, with
profile metrics rendered as grouped tables and application profile families flattened.
(#23357, #23462,
#23524, #23551,
#23599, #23601,
#23606, #23607,
#23616)
Windows: Hyper-V, RDP and Broader Coverage
Windows monitoring continued to expand:
- Hyper-V monitoring in
windows.plugin: aggregate VM health counts, per-VM memory and performance, and
root-partition virtualization metrics. - Remote Desktop Services sessions: aggregate active and inactive sessions, for the remote-access path that Windows
fleets actually run on. - CPU charts added to the Windows plugin, plus an
exclude space metrics on pathssetting that keeps selected
volumes out of the disk-space charts. - Cluster Shared Volumes and folder-mounted volumes now get disk-space charts at their mount paths, with
filesystem, serial number, read-only, drive type and mount path labels; some of these volumes were missing from
performance-counter results. Mount-point discovery and space queries run on worker threads with timeouts, keeping a
blocked volume query off the main collection path. - Network connections topology (
topology:network-connections) now works on Windows, bringing the network viewer to
Windows hosts. - Clearer OS labels on Windows: the OS name is now reported as "Microsoft Windows", and new host labels
(_os_marketing_version,_os_release,_os_edition,_os_build) let Windows nodes be filtered by version, release
or edition._os_versionkeeps its existing display value for compatibility. - Fixes to Windows alerts, to claiming on Microsoft platforms, and to the MSI installer's verbose logs, which no longer
contain the claim token.
(#22119, #23453,
#23547, #23549,
#23559, #23562,
#23660, #23719,
#23720, #23735)
Secrets and Privilege Hardening in go.d
go.d collectors can resolve credentials from files and from external commands. This release systematically removes
elevated privileges from those paths:
- File secrets are read without elevated privileges, and configured credential-file reads drop privileges before
touching the file. - Command secret providers run through
nd-run, the agent's mediated execution helper, which gained one-shot
unprivileged file operations and opt-in environment preservation to support exactly this. - Secret references in discovered jobs stay literal by default, even when the reference comes from an
operator-authored discovery rule, so a discovered target cannot make the agent dereference a secret on its behalf.
A service-discovery pipeline you trust can opt back in withtrust_discovered_targets: yes.
The execution privileges of secret resolution, and the exposure surface of SNMP scanning, are now documented rather than
implied.
(#23865, #23868,
#23879, #23884,
#23887, #23916,
#23918, #23923)
Query Engine: Correctness and Faster Weights
A dedicated correctness pass on the query engine landed six independent fixes to query values, flags and timestamps —
cases where a query returned a plausible-looking but wrong answer:
sumresults stay exact when stored points span two result rows or a storage-tier boundary;- incremental-sum queries keep their baseline when a result bucket holds only its opening sample;
- anomaly-rate contributor counts stay correct when a query groups data in two passes;
- the
absoluteoption is applied at a storage-tier switch, so a negative value can no longer slip through; - counter resets and anomaly flags are attributed to the result row that holds the stored sample, not to neighbouring
rows that reuse or interpolate its value; - explicit and relative single-point
latestwindows derive their result timestamps from the requested window instead
of from the edge of retention;before=0still asks for the database end.
These were found and pinned down by a new layered black-box query contract corpus — tests that state what a query
must return, independently of how the engine computes it.
Weights (metric correlations) queries also received two correctness fixes. A v1 weights or metric_correlations request for
a specific host now scores that host's metrics. An inverted condition used to drop the host selected in the URL.
Average anomaly-rate scoring now counts missing samples as zero rather than leaving them out, so a metric with one
anomalous sample in a mostly empty window no longer scores 100% next to metrics that are anomalous throughout.
On the performance side, the weights endpoint reuses its query arena, and KS2 comparison overhead
was reduced with monotonic cursors. Ranked weights responses now support limits across all API formats, and the API
accepts HTTP requests up to 1 MiB.
(#23130, #23503,
#23504, #23505,
#23507, #23508,
#23512, #23744,
#23759, #23777,
#23779, #24080,
#24081)
Agent Stability: dbengine, SQLite, ACLK and ML
A long run of stability work closed out crashes, hangs, leaks and shutdown races. Most of it reached users first in the
2.11.1 patch release and is consolidated here.
dbengine — flush and shutdown workers that wait for extent writes are now bounded, so they can no longer by
themselves exhaust the libuv worker pool and hang the agent, most visibly at shutdown. Merged extent query teardown is
synchronized and merged page references are acquired before publishing (both were use-after-free windows), an empty
flush batch counter leak was fixed, negative tier retention reporting was corrected, valid long page cadences are
accepted, a stale MRG metric double free in journal files was fixed, and PGC cache fatal messages now include the full
page identity.
SQLite and health — SQLite lifetime races during agent shutdown were fixed, along with a statement-preparation error
check in sqlite_health, unused health_log_detail indexes were removed, alerts are no longer reinitialized for
unchanged charts, raised-alert summaries are populated lazily for notifications, and alerts are indexed by name for
faster variable lookups.
ACLK — TLS hostname and IP verification was added for HTTPS requests, host teardown is safe against queued commands,
shutdown no longer waits unbounded during connection setup, MQTT PUBACK timeouts are reported separately and preserved
while offline, waived self-signed certificates are no longer reported as verification failures, and alert transitions
queued while an earlier one is in flight are no longer dropped from the Cloud alert queue.
Streaming — a parent now rejects ML models streamed by a child for any host other than the one the child
authenticated as, and validates a child's complete machine GUID before storing it, preventing a one-byte buffer overrun
and erroneous duplicate rejection on reconnect. Host label changes on a child now propagate through every parent without
a reconnect (#23988,
#23991, #24015).
Plugins — apps.plugin and freeipmi.plugin now keep Function responses separate from chart updates, so an
overlap can no longer misassign metrics or disable the plugin (#24050,
#24052). A use-after-free in the Function event loop shared by
several C plugins could crash a plugin under rapid Function calls; the queueing thread now holds a reference to each
job for as long as it uses it (#24071).
Memory and lifecycle — ML worker queue teardown is deferred until collectors stop, ML memory use was reduced through
lazy model allocation, glibc mallinfo2 pulse overhead was reduced, KSM support is probed before deduplication is
enabled, UUID map create/free churn was removed from metric lookups, the obsolete chart reaper no longer frees
referenced charts, and a dictionary GC use-after-free on reentrant delete callbacks was fixed. In default builds (without
mimalloc), the ML memory line now tracks all C++ allocations, dominated by ML, through the agent's global new and
delete operators, including aligned allocations and cross-thread frees, at allocator block sizes where the platform
reports them; frees that would take the total below zero are counted as unmatched_free on netdata.ml_memory_ops
(#22477).
Netdata Cloud: Infrastructure Knowledge, Node Decommissioning and AI Conversations
Note
Netdata Cloud ships continuously rather than on the Agent's release cadence. This section covers Cloud changes that
shipped since v2.11.0. If you use Netdata Cloud, you already have them — nothing here requires an Agent upgrade.
Infrastructure Knowledge. Netdata AI sees what your infrastructure does — every metric, anomaly and alert. It
cannot see what your infrastructure is: which services matter, which host is supposed to run hot, what your team
considers normal. Infrastructure Knowledge
is where that context lives, under Manage Space → Infrastructure Knowledge, in two tabs:
- Your Context — one shared Markdown document per Space, with section templates for an infrastructure overview,
service tiers, known behaviours, SLOs and business context, team preferences, upcoming events and architecture notes.
Every save keeps a version you can compare and restore, and Netdata AI can update the document when you ask it to in a
conversation. - AI Memory — single facts Netdata AI learns as you work with it, such as "remember that the 02:00 disk spike on
backup-01 is expected". It tells you when it records one, and the tab lets you read, delete or clear them.
Both are read before every conversation, investigation and report. Netdata AI uses them to interpret telemetry, never to
override it: when your context changes a conclusion it says so, and when your context and the data disagree it tells you
rather than picking a side. See the Infrastructure Knowledge blog post
for a walkthrough.
Important
Infrastructure Knowledge is available on paid Netdata Cloud plans. Space admins, managers and troubleshooters can
edit it; observers can view it.
Node decommissioning. A node that is being retired can now be marked as decommissioned, so it stops generating
notifications while it winds down — without deleting it and without touching its Agent connection. In Space Settings
→ Nodes, toggle a single node or a selection in bulk; the change can be undone at any time. Decommissioned nodes are
flagged on the Nodes page and on the single-node page, where they can also be toggled, and the Nodes page can group by
commission state. Decommissioning requires the same permission as removing nodes. See
Node Decommissioning.
AI conversation upgrades. Netdata AI conversations became more durable and more transparent:
- Conversations survive a closed tab. Each turn is saved and processed on the server, independently of the browser
connection, so closing the tab or losing the connection no longer loses the answer. Stop now cancels generation on
the server, and only successful answers are billed. - Long conversations keep going. When a conversation approaches the model's context limit, the oldest turns are
summarized and the newest kept verbatim, instead of every further turn failing. - Visible reasoning. The model's thinking streams into the conversation as it works, collapsed by default and
labelled with how long it took. - Clearer context. Each message shows the context that was sent with it, a conversation started from a chart
highlight keeps that time range, your own messages render as Markdown, and long runs of tool calls collapse behind an
expandable "N more tools" control.
Traces, in Early Access. There's a new Traces tab for exploring the OpenTelemetry traces your v2.12.0 agents
collect. Switch it on from Early Access in the sidebar and take it for a spin — more in
OpenTelemetry Traces, in Early Access.
Platform Support Changes
As announced in the v2.11.0 release notes, v2.12.0 no longer ships native packages for RHEL 7.x, CentOS 7.x, Amazon
Linux 2 and compatible platforms. RHEL 7.x reached the end of standard maintenance on 2024-06-30 and our end of
support was deliberately delayed for the customers still on it; Amazon Linux 2 reached end of life on 2026-06-30. Static
builds are the recommended replacement, and new installs switch to them automatically.
Two further platforms were retired on the same principle: Debian 11, whose upstream LTS ended on 2026-08-31, and
Ubuntu 25.10, which went end of life on 2026-07-09.
On the build side, source-based installs and updates now fetch a zstd-compressed source archive when zstd is
available — about 30% smaller than the gzip one — and kickstart.sh no longer skips source archive verification when
asked for a specific version. Nightly and stable release artifacts are now also published to a Cloudflare R2 bucket,
the build system handles release candidate versions, and attempting to update an unsupported install is now fatal in
kickstart.sh rather than silently doing nothing.
(#22440, #22930, #22931,
#23211, #23253,
#23712, #23813,
#24013)
Acknowledgments
We would like to thank our dedicated, talented contributors that make up this amazing community. The time and expertise
that you volunteer is essential to our success.
- @macmandr197 for making the PAN-OS collector collect BGP peers on the Advanced
Routing Engine. - @esafak for fixing a typo in the
clickhouse.replicas_max_absolute_delayalert. - @methanoya for finding and fixing a use-after-free in the Function event loop shared by
external plugins.
Contributions
Collectors
New Collectors and Plugins
- Added Redfish monitoring of server hardware through the DMTF Redfish API of a baseboard management controller, with sensor and hardware inventory Functions, independent per-sensor threshold health, an on-demand BMC logs viewer, enriched hardware detail, and an operator-facing integration page; the collector was subsequently simplified onto the
gofishlibrary with endpoint acquisition, measurement conversion and chart templates separated out (go.d/redfish). (#23343, #23909, #23912, #23915, #23922, #23926, #23929, #23933, #23938, #23943, #23949, #23950, #23957, #23962, @ktsaou, @ilyam8) - Added S3-compatible object storage monitoring with active write/read/list/delete probe checks and cross-site replication timing, then redesigned for safer and clearer operation (go.d/s3check). (#23669, #23731, @ktsaou, @ilyam8)
- Added SMBIOS memory inventory monitoring with persistent memory loss detection against an accepted baseline, identifying each slot by its bank and device locator (go.d/smbios_memory). (#23965, #24043, @ilyam8)
- Added OpenTelemetry trace ingestion, trace-aware columnar storage (span extras, trace row index, bloom filters, span combination and rollups) and the
otel-tracesquery Function, with a Functions search view that breaks each trace's spans down by service, an embedded window aggregate, and an overview heatmap filtered by the page's selections. With remote storage enabled, trace queries read locally evicted files back through the cache shared with logs, and spans without an explicit kind or status store the OpenTelemetry defaultsUNSPECIFIEDandUNSET, so filters such asstatus != ERRORreach them (otel-plugin, otel-ledger, sfst). (#23479, #23738, #23739, #23905, #24088, @vkalintiris, @novykh) - Added Hyper-V monitoring (aggregate VM health, per-VM memory and performance, root-partition virtualization metrics) and Remote Desktop Services session monitoring to the Windows plugin (windows.plugin). (#22119, #23719, @thiagoftsm)
SNMP and Network Topology
- Added a full SNMP topology diagnostics layer: per-walk timing and preparation diagnostics, profile context and failure details, topology source and processing diagnostics, recurring per-device diagnostics, bounded retained evidence, retained topology acquisition history, and publication independent of whether topology collection succeeded (go.d/snmp, go.d/snmp_topology). (#23665, #23667, #23753, #23791, #23794, #23797, #23798, #23800, #23806, @ilyam8)
- Added portable topology diagnostic archives, an archive diagnostic tool, offline diagnostic inspection, hermetic topology graph replay, link inspection by replay index, support-bundle integration, and inspection of diagnostics directly from support bundles (go.d/snmp, go.d/snmp_topology). (#23670, #23675, #23680, #23682, #23709, #23716, #23808, #23827, @ilyam8)
- Expanded SNMP coverage from 272 to 286 profiles: LLDP-V2 topology for PAN-OS, a Meraki products L2 topology profile,
IpAddressTablesupport, MikroTik SwOS and hardware profiles, a Ubiquiti net-snmp profile, and reusable topology-role profiles (classic bridge, qbridge, STP, L3 neighbor) over standard-MIB building blocks; system scalars are now queried with GET requests and profile definitions were cleaned up (go.d/snmp, go.d/snmp_topology). (#23717, #23723, #23724, #23807, #23821, @ilyam8) - Made FDB-inferred topology reliable by default, published immutable topology generations, rejected ambiguous FDB alias owners, decoded and validated LLDP management addresses, selected usable management IPs, enabled UniFi topology profiles, corrected device metadata, and counted all managed topology devices as discovered (go.d/snmp, go.d/snmp_topology, go.d/l2topology). (#23536, #23546, #23557, #23561, #23587, #23588, #23659, #23678, #23713, #23715, @ilyam8)
- Fixed SNMP device identification and metrics: UniFi devices resolved from
sysDescrand identified as Ubiquiti, Synology profile detection and metrics, the MikroTik gauge transform, the Aruba fan status OID, scalar fallback order, and missing profile identity diagnosis; device identity acquisition was extracted into a reusable component, which accepts a valid numericsysObjectIDsupplied as anOctetString(as some printers do) and treats unusable values as absent so manual profiles apply (go.d/snmp). (#23478, #23525, #23565, #23577, #23594, #23635, #23718, #23817, #24031, @ilyam8) - Added a permanent SNMP troubleshooting data workflow, generic topology response notifications, and validation of topology search labels, aggregation memberships and typed set cells in scalar columns (snmp, topology). (#23681, #23776, #23788, #23803, @ktsaou)
- Added network connections topology support on Windows (network-viewer). (#23562, @ktsaou)
- Collected BGP peers on the PAN-OS Advanced Routing Engine (go.d/panos). (#23636, @macmandr197)
Improvements
- Added independently configured static and SNMP-backed virtual nodes, with configured vnode metadata authoritative for the jobs that reference them; an initially configured or discovered enabled job that references a vnode not yet defined, or an SNMP vnode still acquiring its identity, waits and starts when it becomes available, even with
autodetection_retry: 0, while an interactive update to a running job is rejected until the vnode is ready (go.d). (#23820, #23823, #24011, #24024, @ilyam8) - Reworked the Ceph collector as a complement to the Prometheus collector, migrated it to collector framework v2, added first-phase monitoring and stock alert coverage, ordered profile charts by operator priority, and added support for Ceph Tentacle hardware and PG rebuild metrics (go.d/ceph, go.d/prometheus). (#23357, #23462, #23524, #23551, #23599, @ktsaou, @ilyam8)
- Published stock Prometheus profile coverage as generated documentation, rendered profile metrics as grouped tables, and flattened application profile families (go.d/prometheus). (#23606, #23607, #23616, @ktsaou, @ilyam8)
- Hardened go.d secret resolution: file secrets are read without elevated privileges, configured credential-file reads drop privileges, command providers run through
nd-run, secret references in discovered jobs are left unresolved unless the pipeline setstrust_discovered_targets, and activation outcomes were unified with secret retries restored (go.d, go.d/secrets). (#23847, #23865, #23879, #23884, #23916, #23918, @ilyam8) - Added a readiness-aware collector runtime lifecycle, collector-wide
store_firstfor V2 charts, named active chart template sets, managed metadata for payload-aware functions, and support for unavailable snapshot MeasureSet fields; chart template autogen routes are cached and expiry optimized, the V2 publication path allocates far less per cycle, template-set chart ID collisions resolve in compile order and are logged instead of silent, and collectors can classifyInit/Checkfailures as permanent (never retried) or temporary (go.d, go.d/chartengine, go.d/metrix, go.d/collectorapi). (#23814, #23940, #23971, #23975, #23980, #23982, #23996, #24002, #24004, @ilyam8) - Built an experimental Go StatsD collector — a measurement core, receiver runtime and profiles, with allocation-free ingest for existing series — and moved it into its own
statsd.plugin, with alistenmodule that has a Dynamic Configuration form and a stockstatsd/listen.confthat enables no listener. A listener can use UDP, TCP or both; omittingprotocolselects both (statsd.plugin). (#23987, #23992, #23995, #24016, #24028, @ilyam8) - The Go StatsD plugin does not ship in v2.12.0 packages: source builds include it only with the
ENABLE_PLUGIN_STATSDCMake option ornetdata-installer.sh --enable-plugin-statsd, both off by default, and the built-in C StatsD server remains the StatsD path. In the plugin,metric_idle_timeoutaccepts a duration and defaults to 30 minutes, and secret references are not resolved:${...}in its configuration stays literal (statsd.plugin). (#24016, #24028, #24030, @ilyam8) - Allowed chart template root groups without a family and made chart priority defaults inheritable (go/charttpl). (#23600, #23602, @ilyam8)
- Converted the eBPF Directory Cache algorithms and the File Descriptor monitor to Go (ebpf.plugin). (#23451, #23642, @thiagoftsm)
- Added CPU charts and disk filtering to the Windows plugin, normalized Windows OS host labels (name, version, release, edition, build), and added a
system.processes_statechart on macOS and FreeBSD (windows.plugin, apps.plugin, daemon). (#23453, #23534, #23549, #23660, @thiagoftsm, @ktsaou) - Added disk-space monitoring of Cluster Shared Volumes and folder-mounted volumes at their mount paths, with volume labels, rediscovery every 60 seconds, a grace period before transiently unavailable volumes lose their charts, and space queries on cancellable worker threads (windows.plugin). (#23720, @thiagoftsm)
- Developed a native script collector for
scripts.d, supporting one-shot and persistent scripts in any language, labeled metrics, health checks, package-specific Dynamic Configuration forms and Functions, on a newndexecAPI that terminates a script together with the descendants in its process group (a Job Object on Windows) when the script exits, times out or is canceled. The collector does not ship in v2.12.0: it registers only with thescripts_native_devGo build tag, and its contract is still in development (scripts.d, ndexec). (#24075, #24076, #24077, #24078, #24079, #24084, #24086, @ilyam8) - Improved MSSQL monitoring: a Functions fallback, hardened Function queries across SQL Server and Azure, separate Function timeouts with deadlock targets resolved, disabled SQL Agent jobs excluded by default, MSSQL 2014 issues addressed, and Functions isolated behind a dependency interface (go.d/mssql). (#23460, #23564, #23645, #23748, #23976, #23978, @thiagoftsm, @ilyam8)
- Centralized one-shot task handshakes and extracted shared relabel processing (go.d). (#23859, #23985, @ilyam8)
- Improved the support bundle: streaming API key handling, encoding fidelity, Windows ETW logs and permissions; stopped it collecting a removed go.d state file; captured what actually grants journal access and added an opt-in plugin debug; improved Unix script maintainability and reliability; and updated the bundle script (support-bundle). (#23452, #23818, #23825, #23894, #23947, @shyamvalsan, @ilyam8, @thiagoftsm)
Bug Fixes
- Fixed go.d collection status reporting: V2 collection status and duration charts were restored, Function failures are reported and the finalizer context honored, job-scoped Function metadata is returned, accepted job activation converges asynchronously, shutdown errors are preserved through redaction, unaligned chart engine atomics were removed, and changed chart definitions are recreated after expired revival (go.d, go.d/chartengine, go.d/jobmgr). (#23540, #23653, #23708, #23858, #23944, #23946, #23984, @ilyam8)
- Separated configuration adoption from runtime activation in Dynamic Configuration for go.d jobs, service discovery pipelines and secret stores, so a reply states what was adopted rather than whether it is already running: changes that need activation generally answer
202and report startup success or failure through configuration status, a rejected update leaves the running job and its previous configuration in place, an applied change is no longer dropped when a cancel or deadline arrives mid-apply, and discovery keeps draining when a job's process is retired (go.d, go.d/jobmgr, go.d/secrets). (#24010, #24011, #24014, #24020, #24023, @ilyam8) - Kept vnode names exactly as entered and validated them instead of silently rewriting them, passed Function command arguments to configuration-name validation with backslashes and Unicode whitespace intact, and stopped republishing unchanged SNMP lifecycle states (go.d, go.d/snmp). (#24019, #24024, #24026, @ilyam8)
- Fixed the NetFlow plugin restart-looping forever when a UDP listen port is already taken. It now waits for its startup rebuild of flow data from stored raw flows and for every UDP listener to bind before publishing
flows:netflowor any chart; a bind failure, or a rebuild scan that reaches 30 seconds, exits without publishing. On its first start since Netdata started, the agent then disables the plugin until Netdata restarts; if it ran successfully earlier, the agent retries and disables it after repeated failed starts (netflow-plugin). (#24029, @vkalintiris) - Fixed
apps.pluginandfreeipmi.pluginoutput corruption when a Function response overlapped chart updates: the overlap could put metrics on the wrong chart and disable the plugin until restart, which happened readily on Windows whenprocessesandprocessesinfo calls overlapped. Responses now use the same output lock as charts (apps.plugin, freeipmi.plugin). (#24050, #24052, @ilyam8) - Fixed high idle CPU use in NetIPC shared-memory lookup servers, including those in
apps.pluginandcgroups.plugin, on 32-bit Linux builds with a time64 libc: their 100 ms wait now expires as intended instead of immediately (netipc). (#24049, @ktsaou) - Fixed credential leakage in
go.d/upsdcommand errors. (#23782, @stelfrag) - Normalized
smartctldevice chart identity (go.d/smartctl). (#23529, @ilyam8) - Corrected DCGM GPU chart grouping, units and source selection (dcgm). (#23785, @ktsaou)
- Clamped row counts before converting int64 to int in the AS/400 collector (ibm.d/as400). (#23783, @stelfrag)
- Fixed repeated socket collection attempts in network namespaces, and parsed
/proc/interruptscounters adjacent to labels (proc). (#23651, #23778, @stelfrag, @ktsaou) - Fixed the
charts.ddisabled-message config filename. (#23662, @Copilot) - Fixed alert and claiming issues on Windows, and kept the claim token out of verbose MSI logs (windows). (#23547, #23559, #23735, @thiagoftsm, @stelfrag)
- Fixed a typo in the
clickhouse.replicas_max_absolute_delayalert. (#23548, @esafak)
Packaging/Installation
All changes
- Removed RHEL 7.x, CentOS 7.x and Amazon Linux 2 from CI and package builds, as announced in the v2.11.0 release notes, and made build matrix generation more robust (packaging, CI). (#22930, @Ferroin)
- Removed Ubuntu 25.10 and Debian 11 from CI and package builds, following upstream end of life and end of LTS (packaging, CI). (#22931, #23813, @Ferroin)
- Added an AlmaLinux deploy target to the integrations catalog (integrations). (#23725, @kostasapostolopoulos)
- Published nightly and stable release artifacts to a Cloudflare R2 bucket, changed the R2 nightly artifact prefix from
nightlies/tonightly/, fixed logging and error handling for nightly artifact uploads, dropped retries on artifact downloads, and removed an upload option R2 does not support (CI). (#23649, #23712, #23990, #24000, #24013, @Ferroin) - Added basic handling for release candidate versions in the build system, and updated version parsing in the updater script (build, packaging). (#23211, #23586, @Ferroin)
- Published zstd-compressed source archives, about 30% smaller than the gzip ones and faster to unpack, which
kickstart.shand the updater now prefer for source-based installs whenzstdis available (falling back to gzip); this also fixeskickstart.shskipping source archive verification when installing a user-specified version (packaging). (#22440, @Ferroin) - Made attempting to update unsupported installs fatal in
kickstart.sh, fixed install-prefix sanitization for safe paths, and fixed handling of package publishing detection in the updater script (packaging). (#22027, #23253, #23830, @Ferroin, @Copilot) - Fixed
install-required-packages.shdetection and tree-validation correctness (installer). (#23408, @stelfrag) - Raised the Go toolchain baseline to 1.27, bumped the Kubernetes client libraries to 0.37.0, and updated SQLite to 3.53.4 (build). (#23511, #23679, #23696, @ilyam8, @stelfrag)
- Restricted the eBPF plugin to 64-bit userlands, bounded eBPF Go dependency discovery, and made AddressSanitizer detect pooled allocator use-after-free (build). (#23446, #23566, #23608, @stelfrag, @ktsaou)
- Improved macOS compatibility with older SDKs (macos). (#23421, @stelfrag)
- Avoided package builds for Go-only changes, hardened CI change detection for large pull requests, raised job concurrency limits for GHA workflows, and included the base commit SHA in PR JSON output (CI). (#23477, #23530, #23637, #23741, @ktsaou, @ilyam8, @stelfrag, @Ferroin)
- 78 Dependabot updates, chiefly Go modules including gRPC, AWS SDK packages and the Kubernetes client libraries, plus a Python dependency of the MCP automation tooling and a GitHub Actions dependency (@dependabot).
Documentation
All changes
- Rewrote the Logs section as the Logs Management operator's manual, and gave the OpenTelemetry landing page a distinct rendered title (docs/logs, docs/opentelemetry). (#23687, #23755, @ktsaou)
- Added a trace storage and retention page to the OpenTelemetry documentation, described the remote-read cache shared by logs and traces, and removed the tenant-selection guidance, since dashboard queries use only the default tenant (docs/opentelemetry). (#24088, @vkalintiris)
- Wrote the Redfish integration page for operators, and added collector metadata content rules plus a known-errors troubleshooting section to the integrations pipeline (docs, integrations). (#23763, #23962, @ilyam8)
- Documented secret-resolution execution privileges and SNMP scan exposure (docs/secrets). (#23923, @ilyam8)
- Published stock Prometheus profile coverage, emitted MDX-safe profile details, clarified generated profile catalogues and vLLM distribution questions, and kept internal profile questions internal (docs/prometheus). (#23607, #23610, #23611, #23613, #23614, @ktsaou)
- Documented chart annotations, MCP Custom MCP Server requirements and FAQ, the PagerDuty MCP Connection guide, the Netdata AI Infrastructure Knowledge page, node decommissioning instructions, and the Netdata Cloud outbound IP addresses endpoint; fixed stale
netdata-build-mcpsetup and auth docs. (#23537, #23633, #23656, #23752, #23786, #23810, #23812, @shyamvalsan, @juacker, @vkalintiris, @witalisoft, @papazach) - Completed collector documentation descriptions, corrected zRAM and eBPF VFS descriptions, corrected Ceph integration examples and Prometheus expiry guidance, pointed the notifications README at the current Netdata AI troubleshooting page, and fixed the Kavenegar notification documentation link. (#23476, #23487, #23582, #23601, #23644, @ktsaou)
- Aligned documentation checks with the Learn runtime, repaired generated Learn link sources, fixed stale links in Agent documentation sources, and documented Learn checksum ownership and recovery validation (docs). (#23591, #23593, #23595, #23652, @ktsaou)
- Reworked the repository's AI-assistant skills: area-prefixed names, a repo-skill-authoring guide, a Go collector design skill, an offline diagnostics triage skill, a support-bundle triage skill, chart template authoring ownership in the V2 collector skill, evidence requirements for added design complexity, risk-proportionate review and delegation policies, and corrections to unsafe guidance and failing script paths. (#23742, #23743, #23745, #23754, #23769, #23775, #23784, #23790, #23792, #23793, #23799, #23805, #23828, #23831, #23845, #23860, #23866, #23895, #23910, #23917, #23959, #23967, @ilyam8, @shyamvalsan)
- 34 regenerations of the integrations documentation keeping the catalog in step with collector metadata (@netdatabot).
Other Notable Changes
Improvements
- Added a layered black-box query contract corpus that states what the query engine must return independently of how it computes it (query). (#23130, @ktsaou)
- Supported ranked weights response limits across all API formats, and accepted HTTP requests up to 1 MiB (api). (#23744, #23777, @ktsaou)
- Optimized weights query arena reuse and reduced KS2 comparison overhead with monotonic cursors (query). (#23759, #23779, @ktsaou)
- Refactored the function-call mechanism into a first-class component (daemon). (#23532, @vkalintiris)
- Added TLS hostname and IP verification for ACLK HTTPS requests, and improved timeout handling for HTTPS and MQTT clients (aclk). (#23105, #23463, @stelfrag)
- Reduced ML memory usage with lazy model allocation, cached per-child streaming chart references, avoided redundant chart metadata re-interning, indexed alerts by name for faster variable lookups, and removed unused
health_log_detailindexes (ml, pulse, rrd, health). (#23554, #23603, #23710, #23722, #23760, @stelfrag) - Charted dbengine extent decompression throughput, and let the
mallinfointerval separate completed measurements (pulse). (#23671, #23736, @stelfrag) - Added one-shot unprivileged file operations and opt-in environment preservation to
nd-run(nd-run). (#23868, #23887, @ilyam8) - Advertised
minItemson required array parameters, dropped a dead NULL check inmcp_function_get_info, and added CI coverage proving that MCP API keys protect the MCP HTTP, SSE and WebSocket endpoints without unlocking the agent's REST API (MCP). (#23655, #23809, #24001, @stelfrag) - Fixed MCP
query_metricsreturning empty results when a hidden dimension such assystem.cpu:idlewas requested explicitly (MCP). (#24018, @Copilot) - Continued development of a native Go notification agent (36 pull requests: routing, a reader for the existing
health_alarm_notify.conf, and typed providers for the notification methodsalarm-notify.shsupports today). It does not ship in v2.12.0: it builds only behind theENABLE_ALARM_NOTIFY_GOCMake option, which is off for every release artifact, andalarm-notify.shremains the notification path (health/alarm-notify). (#23870, #23871, #23872, #23874, #23875, #23876, #23877, #23878, #23880, #23881, #23882, #23883, #23886, #23888, #23893, #23897, #23898, #23900, #23901, #23902, #23906, #23907, #23908, #23911, #23913, #23914, #23919, #23921, #23925, #23928, #23930, #23931, #23934, #23937, #23939, #23941, @ilyam8)
Bug Fixes
- Fixed six query engine correctness defects: exact
sumresults across result rows and storage-tier boundaries, preserved incremental-sum baselines, correct anomaly-rate contributor counts in two-pass grouping,absoluteapplied at storage-tier switches, counter resets and anomaly flags attributed to the row holding the source sample, and single-pointlatesttimestamps derived from an explicit or relative requested window rather than from retention (query). (#23503, #23504, #23505, #23507, #23508, #23512, @ktsaou) - Fixed dbengine defects: flush and shutdown workers that wait for extent writes are bounded, and pool threads no longer flush inline, so they can no longer by themselves exhaust the libuv pool and hang the agent (for example at shutdown, on "wait for dbengine collectors to finish"); merged extent query teardown is synchronized, merged page references are acquired before publishing, an empty flush batch counter leak was closed, negative tier retention reporting was corrected, valid long page cadences are accepted, a journalfile stale MRG metric double free was fixed,
-W createdatasetwas repaired, and PGC cache fatal messages carry the full page identity (dbengine). (#23475, #23514, #23521, #23522, #23560, #23648, #23699, #23758, #24027, @stelfrag, @ktsaou) - Fixed SQLite lifetime races during agent shutdown and a statement-preparation error check in
sqlite_health, and guarded SQLite cache-status reads when a database is unavailable, preventing aPULSE-SQLITE3crash when the metadata database fails to open and skipping invalid cache samples instead of charting them as counter resets (sqlite). (#23545, #23844, #24012, @stelfrag) - Fixed health behavior: alerts are no longer reinitialized for unchanged charts, raised-alert summaries are populated lazily for notifications, and health initialization flag behavior on child disconnect was clarified (health, rrdcalc). (#23515, #23541, #23544, @stelfrag)
- Fixed ACLK behavior: host teardown is safe against queued commands, shutdown is bounded during connection setup, MQTT PUBACK timeouts are reported separately and preserved while offline, waived self-signed certificates are no longer reported as verification failures, alert transitions queued during an in-flight send are no longer lost, messages whose protobuf payload cannot be serialized are discarded instead of sent incomplete, and the manifest publication record was cleaned up (aclk). (#23486, #23580, #23732, #23733, #23734, #23864, #23983, #24012, @stelfrag)
- Fixed memory-safety and lifecycle defects: a dictionary GC use-after-free on reentrant delete callbacks, dictionary destruction deferred while dictionary APIs are active, the obsolete chart reaper freeing referenced charts, pooled response buffers and fragmented WebSocket payload masking, text buffer cleanup and a Dynamic Configuration tree sizing race, dead stores and ML queue item copies, ML worker queue teardown deferred until collectors stop, and UUID map create/free churn removed from metric lookups (libnetdata, ml, mrg, rrd). (#23485, #23538, #23634, #23657, #23666, #23757, #23761, #23819, @stelfrag)
- Fixed a use-after-free in the Function event loop used by
apps.plugin,freeipmi.plugin,systemd-journal.plugin,network-viewer.pluginand other C plugins: a worker thread could answer and free a queued Function job while the queueing thread was still reading and writing it, which under rapid Function calls crashed the plugin with SIGSEGV or SIGABRT insidemalloc(). The queueing thread now holds a reference to the job for as long as it uses it, and a refused queue insert answers with an error instead of dereferencing NULL (libnetdata, functions_evloop). (#24071, @methanoya) - Fixed a child being able to stream ML models for a host other than the one it authenticated as, bounded machine GUID copies on short input, and rejected streamed machine GUIDs that are not a whole UUID, closing a one-byte overrun of the host's GUID buffer (ml, streaming, database). (#23988, #23991, @stelfrag)
- Fixed streaming compression precedence and cadence-aware receiver liveness, incremented the label version only on actual label mutations, and forwarded a child's host label changes through every parent without a reconnect, keeping Cloud node info and alert matching current; relayed children no longer inherit a parent's
_net_default_ifacelabel (streaming, rrd). (#23513, #23615, #24015, @ktsaou, @stelfrag) - Fixed safety and correctness issues found by static analysis:
sprintfreplaced withsnprintfzininicfg, dynamicprocnetdev format strings replaced, a logical operator corrected in ajsonwrapcondition, KSM support probed before enabling deduplication, SIGPIPE reset in spawned children with deterministic regression tests, OpenTSDB telnet host and prefix characters preserved in exporting, glibcmallinfo2pulse overhead reduced, redundant pulse chart metadata version bumps prevented, and assorted Coverity findings (libnetdata, exporting, pulse, spawn). (#23450, #23553, #23579, #23638, #23639, #23650, #23749, #23751, #23815, #23822, @stelfrag) - Fixed two weights (metric correlations) defects: v1 weights and
metric_correlationsrequests now score the host selected in the URL instead of dropping it, and average anomaly-rate scores count missing samples as zero, so a sparse metric with one anomalous sample no longer scores 100% (api, query). (#24080, #24081, @ktsaou) - Fixed ML memory accounting in builds without mimalloc (the default): the global C++
newanddeleteoperators now account every allocation path, including aligned,nothrowand cross-thread frees, at allocator block sizes where the platform reports them (including the Windows MSYS2 runtime), and frees that would underflow the tracked total are counted as anunmatched_freedimension onnetdata.ml_memory_ops(ml, pulse). (#22477, @stelfrag) - Fixed 64-bit timestamp formatting on 32-bit targets across logs, queries, replication and API output, and cleared compiler warnings across the C code; multinode weights JSON now reports unselected context and instance indexes as
-1instead of4294967295(libnetdata, daemon, api). (#23997, #23998, @stelfrag) - Removed the unused
registry_generate_curl_urlsfunction, and corrected stale comments and test diagnostics (daemon). (#23464, #23737, @stelfrag)
Deprecation notice
Changed in this release
- OpenTelemetry configuration, if you are upgrading from v2.10.x or earlier: check a customized
otel.yaml
first. The OpenTelemetry plugin was rewritten in v2.11.0, and its configuration is strict: unknown keys, unknown
NETDATA_OTEL_CFG_*variables and keys from the former experimental schema (size_of_journal_file,
number_of_journal_filesand the other journal-file options) stopotel-pluginfrom starting. Former log-storage
values are not migrated, because the storage engine and its defaults changed. When the plugin recognizes the former
schema, its startup error lists the old keys with their replacements (for example,size_of_journal_filebecomes
logs.rotation.default.max_file_size;store_otlp_jsonhas no replacement), so choose new values rather than copying
the old ones. v2.12.0 adds an optionaltracessection with the same rotation and retention options aslogs.
(#22720, #23479) - OpenTelemetry remote storage: the download cache moved. With
remote_storage.enabled, logs and traces now share
one download cache at{base_dir}/remote-read, and startup moves an existing{base_dir}/logs/remote-readthere.
If the new path already exists or the move fails — for example because the old directory is a separate mount — the
old cached files are cleared instead, so point any cache mount at{base_dir}/remote-read.
(#24088) - Ceph: one chart context was replaced.
ceph.cluster_objects_by_status_distributionis gone; object health is now
reported by separate object-copy health and unfound-object charts. Update custom dashboards, alerts or API queries that
reference the old context. (#23357) - Ceph: stricter job settings and redirects. A
go.d/cephjob that setsmethodorbody, or a custom
Authorization,CookieorHostheader, fails validation. Remove them, and authenticate withusernameand
passwordor withbearer_token_file. The collector also no longer follows a redirect to a different origin, such
as a standby manager pointing at the active one, unless that origin is listed inallowed_redirect_origins; list
every manager's Dashboard origin there. (#23357) - Ceph: per-OSD and per-pool charts are capped. The dedicated
go.d/cephcollector now allows at most 100 selected
OSDs and 100 selected pools by default. Exceeding either limit suppresses the per-entity metrics of that group only,
and the collector logs why. Raisemax_osdsormax_pools, or narrowosd_selectororpool_selector. (#23357) - Service discovery: secret references in discovered jobs are no longer resolved by default.
${env:...},
${file:...},${cmd:...}and${store:...}in jobs generated by service discovery are now kept as literal text,
including references written in your own discovery rules. If a discovery pipeline relied on them, set
trust_discovered_targets: yeson that pipeline, or adopt the job through Dynamic Configuration.
(#23916, #23918) - go.d file and command secrets on Unix run without the plugin's elevated privileges.
${file:...}and${cmd:...}
references now resolve throughnd-runas an unprivileged account (normallynetdata), with no fallback to
privileged access. A credential file that was readable only because of the plugin's privileges no longer resolves,
and commands now get that account'sUSER,LOGNAMEandHOME, withSHELL=/bin/sh. Make sure the account can
read those files and run those commands, and pass explicit configuration paths to tools that relied on the old
environment.
(#23865, #23879, #23884) - Dynamic Configuration replies for go.d describe adoption, not runtime health. An accepted job, discovery
pipeline or secret store change that still has to start may return202; read its configuration status for the
outcome. A rejected update keeps the previous configuration and the running job. Clients that treated a2xxreply
as "running" should check status instead.
(#24011, #24014, #24020) - go.d vnode names created through Dynamic Configuration are no longer rewritten. Names containing whitespace,
colons,=, quotes, backslashes or control characters are now rejected with an error; previously spaces and colons
were silently replaced with underscores. Jobs must reference the vnode by its exact name. ASCII letters, digits,
dots, underscores and hyphens are always safe. (#24024) - Relayed children no longer inherit a parent's
_net_default_ifacelabel. Previously a child streamed through a
parent could carry the parent's uplink interface. A child that supplies the label keeps its own value; for virtual
nodes and older children that do not, the label is now absent. Review label filters that matched a parent's
interface on child nodes. Child host label changes now also reach every upstream parent without a reconnect.
(#24015) - Weights (metric correlations) results may change.
/api/v1/weightsand/api/v1/metric_correlationsnow
score the host selected in the URL. Average anomaly-rate weights, in every API version, count missing collection
slots in the window as zero anomalies, which lowers the scores of sparse metrics and can change their ranking. Review
automation that compares these scores or rankings. (#24080,
#24081) - NetFlow: a port conflict at startup now disables the plugin instead of restart-looping. If a NetFlow UDP listen
port is taken the first time the plugin starts, the agent disables it until Netdata restarts. Free the port or change
the listener, then restart Netdata.flows:netflowand thenetflow.*charts now appear only after startup
completes. (#24029) - SQL Server: disabled SQL Agent jobs are no longer collected by default. Set
collect_disabled_jobs: trueto keep
collecting them. This first shipped in v2.11.1. (#23645) - Windows OS host labels changed. The OS name is now "Microsoft Windows", and
_os_marketing_version,_os_release,
_os_editionand_os_buildwere added;_os_versionkeeps its legacy display value. Review label filters that
matched the old Windows strings. (#23453) - The HAProxy collector is retired, in both
go.dandpython.d. HAProxy exposes a native Prometheus endpoint, and
Netdata ships a stockhaproxyPrometheus profile, so HAProxy monitoring now runs through the
Prometheus collector. Enable the HAProxy Prometheus
endpoint (statssocket with the Prometheus exporter, or HAProxy 2.0+'s built-in/metrics) and point the Prometheus
collector at it. (#23631,
#23632) - Native packages for RHEL 7.x, CentOS 7.x, Amazon Linux 2 and compatible platforms are no longer built. This was
announced in the v2.11.0 release notes; the 2.11.x series was the last to provide them. Static builds are the
recommended replacement, and new installs switch to them automatically.
(#22930) - Debian 11 and Ubuntu 25.10 are no longer built or tested, following upstream end of LTS (2026-08-31) and end of
life (2026-07-09) respectively. (#22931,
#23813) - The legacy RPM packaging code (
netdata.spec.in) remains present but unused and deprecated; official RPM packages are
built through CPack, as they have been since v2.11.0. It is still expected to be removed in a future release.
Important Changes in Next Major Release
Deprecated Components
| Component Type | Versions Being Deprecated |
|---|---|
| APIs | v1, v2 |
What This Means
Only the v3 API and v3 Dashboard will be supported starting with the next major release. These newer versions offer
improved performance, enhanced features, and better security.
Support options
As we grow, we stay committed to providing the best support ever seen from an open-source solution. Should you encounter an issue with any of the changes made in this release or any feature in the Netdata Agent, feel free to contact us through one of the following channels:
- Premium Support: Customers who wish to have a direct channel with Netdata and prioritized support with defined SLAs can contact us.
- Netdata Learn: Find documentation, guides, and reference material for monitoring and troubleshooting your systems with Netdata.
- GitHub Issues: Use the Netdata repository to report bugs or open a new feature request.
- GitHub Discussions: Join the conversation around the Netdata development process and be a part of it.
- Community Forums: Visit the Community Forums and contribute to the collaborative knowledge base.
- Discord Server: Jump into the Netdata Discord and hang out with like-minded sysadmins, DevOps, SREs, and other troubleshooters. More than 2000 engineers are already using it!
Release notes
Netdata v2.11.1 is a patch release to address issues discovered since v2.11.0.
This is a larger-than-usual patch release focused on query correctness, database engine stability, Cloud connectivity robustness, health/alert efficiency, and shutdown and process-lifetime safety, along with a number of collector and platform fixes, including broader SQL Server coverage and Windows CPU and disk improvements.
Query engine
- Preserved exact SUM values when a stored point spans result rows or an automatic storage-tier boundary, and preserved incremental-sum baselines so buckets holding only an opening sample no longer produce empty queries (#23512, #23505, @ktsaou)
- Kept API timestamps independent of each Agent's retention, so the same explicit or relative request returns the same row timestamps across Agents (#23507, @ktsaou)
- Attributed tier-0 RESET and anomaly evidence to the result row that actually contains the source sample, and fixed anomaly-rate contributor counts in two-pass group-by queries (#23504, #23508, @ktsaou)
- Applied
options=absoluteto points fetched from the incoming tier during a plan switch, so a negative value can no longer cross a tier transition unchanged (#23503, @ktsaou) - Fixed a logical operator in the JSON wrapper so unqueried dimensions are excluded as expected unless all dimensions are requested (#23639, @stelfrag)
Database engine
- Fixed a use-after-free and a fatal in merged extent queries by acquiring page-cache references before publishing page details and synchronizing merged extent query teardown under the extent spinlock (#23475, #23521, @stelfrag)
- Fixed a double free of stale MRG metrics during journal v2 migration, and an empty flush-batch counter leak that could leave shutdown or datafile rotation waiting indefinitely (#23560, #23699, @stelfrag)
- Prevented negative and epoch-based tier retention reporting: no 32-bit truncation when formatting durations, unknown or zero start times treated as unavailable, empty journals ignored, and extrapolated retention capped (#23648, @stelfrag)
- Accepted valid page cadences longer than one day instead of treating them as invalid and emitting false repair telemetry (#23514, @ktsaou)
- Avoided UUID map create/free churn and partition write-lock contention during MRG metric lookups, and included full cache and page identity in PGC fatal messages to make cache issues diagnosable (#23538, #23522, @stelfrag)
- Updated the bundled SQLite to 3.53.4 (#23511, @stelfrag)
- Repaired the
-W createdatasetand dbengine stress-test workloads, which crashed on a NULL labels allocator, stamped every generated sample with the wall clock instead of the requested time range, and double-freed state at host teardown (#23758, @stelfrag)
Cloud connectivity (ACLK)
- Added TLS hostname and IP verification for ACLK HTTPS requests, while preserving insecure-mode behavior (#23463, @stelfrag)
- Stopped reporting waived self-signed certificates as certificate verification failures in insecure mode, so later I/O or HTTP errors are reported for what they are (#23732, @stelfrag)
- Switched the HTTPS and MQTT clients to monotonic, microsecond-based timeouts with an I/O progress watchdog, and bounded pre-CONNACK polling to one second so a quiet peer can no longer delay shutdown by up to 60 seconds (#23105, #23733, @stelfrag)
- Stopped counting missing MQTT PUBACKs as successful acknowledgements, tracking them with a dedicated timeout counter that is now preserved across disconnects without touching a freed client (#23486, #23734, @stelfrag)
- Preserved pooled response buffers and their metadata for compressed ACLK responses, and fixed WebSocket masking of payloads spanning ring-buffer boundaries (#23485, @stelfrag)
Health and alerts
- Fixed the Windows
10min_cpu_usagealert attaching toservice.*_cpu_utilizationcharts and firing false CRITICAL alarms (#23559, @thiagoftsm) - Indexed alerts by name per host, replacing full-host alert scans during health-variable resolution (#23554, @stelfrag)
- Avoided re-initializing alert prototypes when chart metadata has not changed, so continuous child-chart re-registrations no longer trigger repeated health re-evaluation (#23515, @stelfrag)
- Built raised-alert summaries only when a notification is actually sent, avoiding per-iteration work and a potential lock-order deadlock with chart removal (#23544, @stelfrag)
- Fixed an incorrect error check on SQL statement preparation in the health database code, and removed two unused
health_log_detailindexes to reduce parent database storage and B-tree maintenance (#23545, #23722, @stelfrag)
Metadata, labels and internals
- Deferred dictionary destruction while dictionary APIs are in flight, making set/get/delete and traversal safe against concurrent destruction during shutdown (#23634, @stelfrag)
- Fixed a use-after-free in dictionary garbage collection when a delete callback re-entered the collector and freed the cached successor mid-walk, and stopped view collections leaving master-deleted items behind (#23819, @stelfrag)
- Stopped the obsolete-chart reaper from freeing a chart another subsystem still references, which left an unindexed chart holding its destroy lock and could fatal a collector still writing to it (#23761, @stelfrag)
- Deferred machine-learning worker queue teardown until after all collectors have stopped, so a collector that outlives the shutdown deadline can no longer abort on a destroyed queue mutex (#23757, @stelfrag)
- Reset and unblocked SIGPIPE in spawned children, so a child whose pipes are closed exits instead of surviving on
EPIPE— which had stranded hundreds ofpowermetricsprocesses on macOS — reported failed signal delivery instead of dropping it silently, and made the spawn-server regression tests deterministic (#23751, #23815, @stelfrag) - Probed for KSM support before enabling page deduplication instead of assuming it, so unsupported kernels no longer report KSM errors, and limited KSM marking to the dbengine page pools that can actually merge (#23822, @stelfrag)
- Skipped sanitizing and re-interning unchanged chart metadata on repeated chart registration, and incremented the label version only on actual label mutations (#23603, #23513, @stelfrag)
- Fixed a text-buffer cleanup issue and a dyncfg tree sizing race during concurrent configuration updates (#23657, @stelfrag)
- Replaced
sprintf()with boundedsnprintfz()in inicfg numeric formatting, and replaced dynamic/proc/net/devpath format strings with literal ones (#23638, #23450, @stelfrag) - Reduced pulse overhead by running
mallinfo2()collection on a configurable, pulse-aligned interval, stamping it after completion so a slow call cannot monopolize the duty cycle, and stopped redundant pulse chart metadata version bumps (#23579, #23736, #23650, @stelfrag) - Removed a per-chart label probe from the pulse child charts, relying on the host label-version compare instead; on a parent with 808 children the probe accounted for about 23% of the main pulse thread and left gaps in the
netdata.*charts it emits (#23760, @stelfrag) - Silenced a Coverity finding and corrected stale comments and unit-test diagnostics, including documenting health-initialization flag behavior while a child is disconnected (#23553, #23737, #23541, @stelfrag)
Collectors and exporting
- Fixed
/proc/interruptsparsing when the first counter is glued to the interrupt ID, which could push changing counter values into dimension IDs and cause unbounded dimension growth (#23651, @stelfrag) - Bounded socket collection to one verified attempt per network namespace, so helper failures no longer trigger repeated collection attempts for every socket record (#23778, @ktsaou)
- Stopped the go.d UPS collector embedding the full command in connection errors, which logged the
PASSWORDcredential in clear text; onlyUSERNAMEandPASSWORDarguments are redacted, so other commands stay diagnosable (#23782, @stelfrag) - Saturated SQL
COUNTresults in the ibm.d AS/400 collector before narrowing them toint, so an out-of-range count can no longer wrap negative and silently change the cardinality limits (#23783, @stelfrag) - Corrected the MikroTik gauge transform in the go.d SNMP collector, and removed unaligned atomics from the go.d chart engine (#23525, #23540, @ilyam8)
- Preserved valid punctuation in OpenTSDB telnet hostnames and metric prefixes, while still replacing whitespace, control characters, and delimiters that would corrupt telnet records (#23749, @stelfrag)
- Fixed the
charts.d.plugindisabled-chart message pointing tocharts.d.plugin.confinstead of the actualcharts.d.conf(#23662, @ilyam8) - SQL Server: added a plan-cache fallback (
sys.dm_exec_query_stats) fortop-querieswhen Query Store is unavailable or disabled, and fell back to the built-insystem_healthsession forerror-infowhen no dedicated Extended Events session is configured (#23748, @thiagoftsm) - SQL Server: hardened the function queries across editions, probing engine edition and version once per instance and routing server-scoped versus database-scoped queries accordingly, so
top-queries,deadlock-infoanderror-infowork on Azure SQL Database and Managed Instance as well as on-premises SQL Server (#23564, @ilyam8) - SQL Server: fixed the deadlock and error-info queries on SQL Server 2014 and older, detecting Query Store by catalog column instead of product version, and reading the event_file path from the session catalog instead of assuming it matches the session name (#23460, @thiagoftsm)
- SQL Server: excluded disabled SQL Agent jobs from collection by default (set
collect_disabled_jobs: trueto keep them) and gated the job alerts on the job being enabled, so a disabled job's last failed run no longer keeps an alert raised (#23645, @ilyam8) - Windows: collected CPU metrics from the
Processor Informationperformance object, mapping itsNumaNode,NumaIndexinstances to logical CPUs via the processor topology, so hosts with more than 64 logical processors are reported correctly; the legacyProcessorobject is still used whereProcessor Informationis unavailable (#23549, @thiagoftsm) - Windows: added
exclude space metrics on pathsunder[plugin:windows:PerflibStorage]to keep unwanted logical volumes (such as temporary backup mounts) out of disk space collection, added a volumeserial_numberlabel, and corrected the misspelleddriver_typelabel todrive_type(#23660, @thiagoftsm)
Installation and packaging
- Windows: fixed claiming when only a token is provided, and marked the claim token and proxy as hidden MSI properties so they no longer appear in verbose installer logs (#23547, @thiagoftsm; #23735, @stelfrag)
- Restricted the eBPF plugin to 64-bit userlands and resolved the Go toolchain from the userland machine type rather than the kernel architecture (#23446, @stelfrag)
- macOS: resolved the IOKit APIs dynamically instead of linking them directly, restoring builds against older macOS SDKs (#23421, @stelfrag)
Support options
As we grow, we stay committed to providing the best support ever seen from an open-source solution. Should you encounter an issue with any of the changes made in this release or any feature in the Netdata Agent, feel free to contact us through one of the following channels:
- Netdata Learn: Find documentation, guides, and reference material for monitoring and troubleshooting your systems with Netdata.
- GitHub Issues: Make use of the Netdata repository to report bugs or open a new feature request.
- GitHub Discussions: Join the conversation around the Netdata development process and be a part of it.
- Community Forums: Visit the Community Forums and contribute to the collaborative knowledge base.
- Discord Server: Jump into the Netdata Discord and hang out with like-minded sysadmins, DevOps, SREs, and other troubleshooters. More than 2000 engineers are already using it!
@ Every self-hosted release, weekly
One Monday email with the week's stable releases across the directory.
FAQ
Who uses Netdata?
Major companies (Amazon, ABN AMRO Bank, Facebook, Google, IBM, Intel, Netflix, Samsung), universities (NYU, Columbia, Seoul National, UCL), government organizations, infrastructure-intensive organizations, technology operators, startups, freelancers, sysadmins, and DevOps professionals.
What telemetry does Netdata collect?
Anonymous telemetry helps improve the product and can be disabled via --disable-telemetry installer flag or by creating /etc/netdata/.opt-out-from-anonymous-statistics.
Do I have to use Netdata Cloud?
No, Netdata Cloud is optional. Netdata works without it, but Cloud adds remote access with SSO, saved dashboard customizations, centralized alert configuration, and role-based access.
What if I feel overwhelmed?
Start small using the dashboard's table of contents and search, explore anomaly scoring, and create custom dashboards in Netdata Cloud.
Can Netdata run alongside Nagios, Zabbix, etc.?
Yes, Netdata can be used together with traditional monitoring tools, providing real-time high-resolution monitoring, zero configuration, and anomaly detection.
How is Netdata different from commercial SaaS tools?
Netdata stores all metrics on your infrastructure with no sampling, no aggregation, no loss, high-resolution metrics by default, ML per metric, and unlimited scalability without skyrocketing cost.
How is Netdata different from Prometheus + Grafana?
Netdata provides a complete monitoring solution with no manual setup, built-in ML, alerts, dashboards, and correlations, and is more efficient and easier to deploy.
Is disk I/O a concern?
No, Netdata minimizes disk usage by flushing metrics every 17 minutes with direct I/O and ZSTD compression, and can run entirely in RAM.
Can Netdata scale to many servers?
Yes, Netdata scales horizontally with many agents, vertically with powerful parents, and infinitely via Netdata Cloud.
How much data retention is possible?
As much as your disk allows, with tiered retention at per-second, per-minute, and per-hour resolutions.
Does Netdata use a lot of resources?
No, Netdata uses minimal resources: ~5% CPU and 150MiB RAM by default, or <1% CPU and ~100MiB RAM with ML and alerts disabled.
Is Netdata secure?
Yes, Netdata follows OpenSSF best practices, has a security-first design, and is regularly audited by the community.
More in Application Performance Monitoring
 netxmsSelf-hosted, open-source network monitoring with L2/L3 topology discovery, distributed agents, NXSL scripting, and no node limits on Linux.
 NightOwl AgentOpen-source Laravel APM agent that captures Nightwatch telemetry into your own PostgreSQL database for full data ownership.
 openobserveOpenObserve is a self-hosted, open-source observability platform unifying logs, metrics, traces, RUM, and AI observability with 140x lower storage costs.
 pyroscopeOpen-source, self-hosted continuous profiling platform: ingest CPU/memory profiles via SDKs, Alloy or eBPF, store in object storage and query flame graphs in Grafana.
 rivetRivet is an open-source, self-hostable orchestrator for AI agents, workflows, and sandboxes as lightweight Actors with SQLite and realtime.
 RustrakRustrak is a self-hosted, open-source error tracker compatible with Sentry SDKs. Change one config line to send data to your own infrastructure.
 sentrySelf-hosted error tracking and APM platform for developers to detect, trace, and fix production issues. Open-source under Fair Source license.
 Sentry Self-HostedSelf-hosted Sentry: the error monitoring platform as a Docker Compose stack of web, workers, Kafka, ClickHouse and PostgreSQL, aimed at low-volume deployments.
 SeqSeq is a self-hosted log server for structured logs, traces, and metrics with real-time search, alerting, and AI integration.
 signozOpen-source observability tool you host yourself, combining APM, logs, traces, and dashboards on OpenTelemetry to replace DataDog.
 StatLiteSelf-hosted monitoring for Spring Boot, Quarkus, Micronaut. Single Go binary, SQLite storage, built-in dashboard — no Prometheus/Grafana needed.
 uptraceSelf-hosted open-source APM unifying OpenTelemetry traces, metrics, logs in one platform. Replaces Datadog/New Relic at lower cost with ClickHouse for billions of spans.
0 comments