
Self-host opnsense-exporter
v0.0.19Prometheus exporter for OPNsense firewall metrics
- Stars
- 274
- Port
- 8080 (Prometheus metrics endpoint)
ghcr.io/athennamind/opnsense-exporter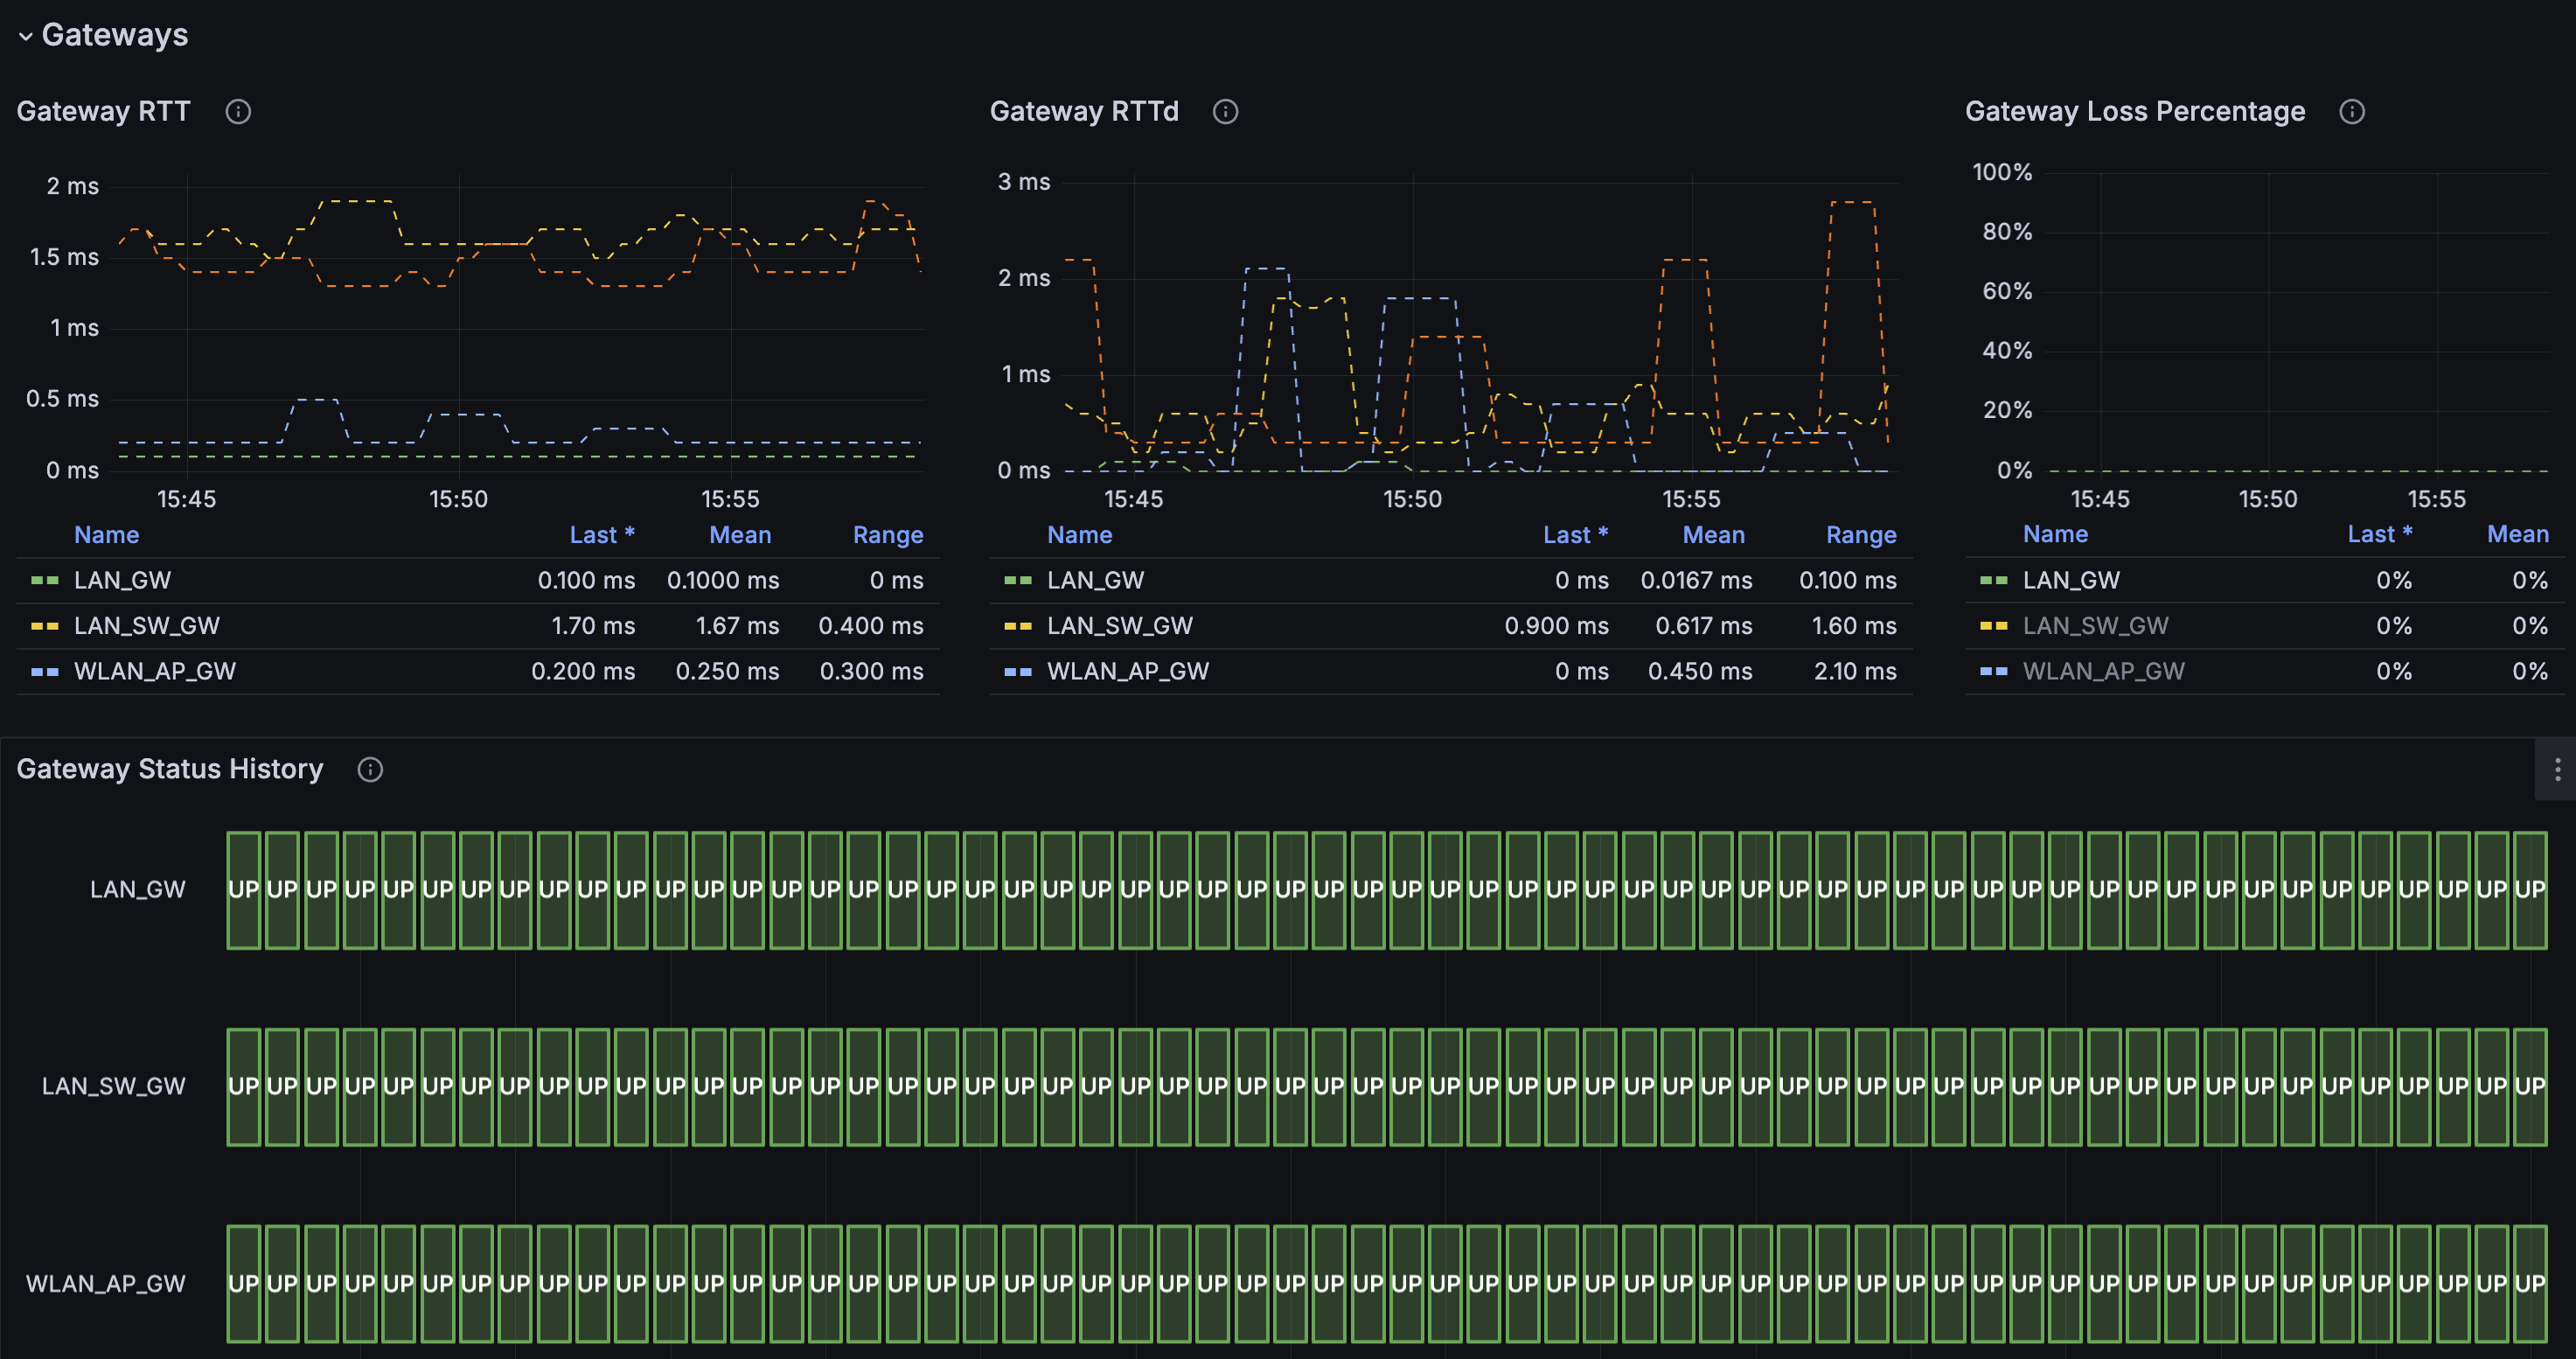
What is opnsense-exporter?
OPNsense Exporter is a Go-based Prometheus exporter that pulls metrics from an OPNsense firewall's REST API. It runs on any host with API reachability, not on the firewall itself. Collectors cover ARP tables, cron jobs, WireGuard, Unbound DNS, OpenVPN, IPsec, packet-filter stats, firmware versions, Kea DHCP leases, thermal sensors, CARP VIPs, PF state tables, and mbuf clusters — each toggleable via flags. A Docker image lives on GHCR; Docker Compose and Kubernetes manifests are provided. A ready-made Grafana dashboard (ID 21113) visualizes the data. Configuration uses CLI flags or environment variables for API credentials, TLS, and per-instance labels.
Should you self-host opnsense-exporter?
opnsense-exporter scores 44/100 on selfhost.directory (how scoring works) and ranks #80 of 104 in Monitoring & observability. It has 274 GitHub stars.
It shipped 7 stable releases in the past year. The latest, v0.0.19, came out on 21 October 2026. New versions land roughly every 5 weeks.
Setup is moderate: expect some configuration beyond a single command. An official Docker image is available. It is Apache-2.0-licensed and written mostly in Go.
Its closest alternative on selfhost.directory is grafana (90/100, 77 568 stars). It scores higher overall, so compare the two before you pick. See opnsense-exporter vs grafana side by side.
Features
- ARP table metrics
- CARP VIP status metrics
- Cron task metrics
- Firewall (pf) metrics
- Firmware metrics
- IPsec metrics
- Kea DHCPv4/v6 lease metrics
- Mbuf cluster usage metrics
- Multi-instance labeling
- OpenVPN metrics
- PF state table usage metrics
- Temperature sensor metrics
- TLS certificate verification control
- Unbound DNS metrics
- WireGuard metrics
opnsense-exporter README
More in Infrastructure Monitoring
 orbOrb is a self-hosted, open-source network observability platform that orchestrates a fleet of lightweight agents to analyze traffic at the edge.
 pcpPerformance Co-Pilot (PCP) is an open-source, self-hosted framework for system-level performance monitoring across distributed systems.
 peekapingOpen-source, self-hosted uptime monitor in Go and React: HTTP, TCP, ping, DNS and database checks, status pages, 20+ alert channels, 2FA and a REST API.
 pi-dashboardSelf-hosted, open-source monitoring dashboard for Raspberry Pi and Linux with live metrics, Docker, WireGuard, REST API, and MCP server for AI assistants.
 project-pegaproxSelf-hosted, open-source web UI for Proxmox VE and XCP-ng with multi-cluster control, live migration, load balancing, and compliance features.
 prometheusPrometheus is a self-hosted, open-source monitoring toolkit that pulls metrics via HTTP, stores them locally, and uses PromQL for powerful queries and alerting.
 prometheus-qbittorrent-exporterSelf-hosted, open-source Prometheus exporter that collects metrics from qBittorrent servers and exposes them for monitoring. Runs via pip or Docker.
 proxcenter-uiSelf-hosted, open-core platform for managing Proxmox VE clusters and PBS — a VMware vCenter alternative with multi-cluster monitoring, automation, and multi-tenancy.
 proxmox-datacenter-managerSelf-hosted open-source platform centralizing management of Proxmox VE clusters and Backup Server instances with unified dashboard, live migration, and enterprise auth.
 ProxPadProxPad is a self-hosted web UI turning tablets into Proxmox VM control centers with macros, media controls, and resource conflict prevention.
 PulseOpen-source, self-hosted ops dashboard for Proxmox, Docker, Kubernetes, vSphere and TrueNAS, with buffered alerts, metric history and scheduled AI patrols.
 PVE-UPSSelf-hosted UPS monitor that shuts down Proxmox VE/Backup Server via API tokens. Browser wizard, SNMP/NUT support, no agents or config files.
0 comments