
Self-host Glances
v4.5.9Cross-platform system monitoring with web interface and API
- Stars
- 33 960
- Port
- 61208 (Web server and RESTful API)
- Requires
- Psutil, Python 3.10+
nicolargo/glances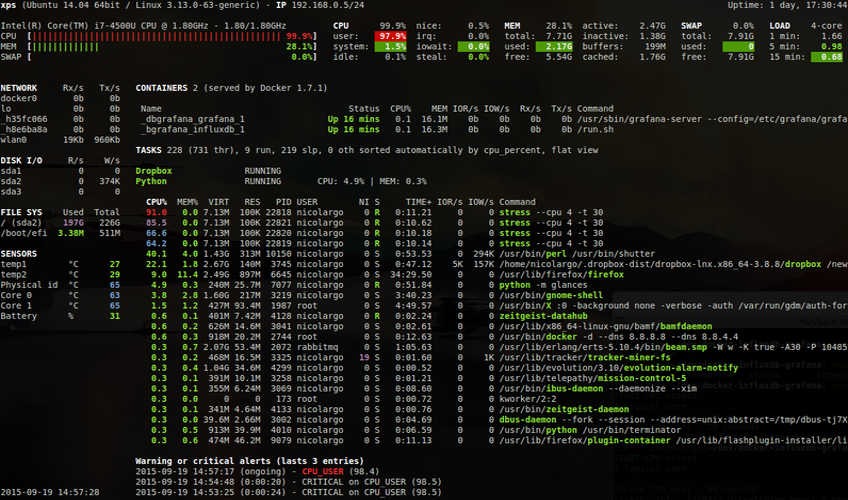

What is Glances?
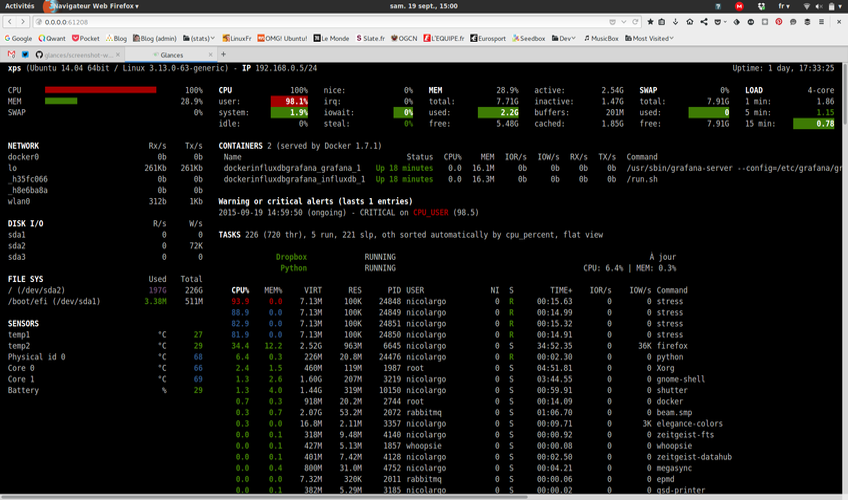
An open-source Python application that monitors system metrics across GNU/Linux, BSD, macOS, and Windows. It displays real-time statistics for CPU usage, memory consumption, disk I/O, network interfaces, running processes, temperatures, voltages, fan speeds, and connected users. The software includes a built-in Web server with a browser-based dashboard accessible at port 61208, plus a RESTful JSON API at /api/5. Users can export data to external time-series databases like InfluxDB, Cassandra, ClickHouse, PostgreSQL/TimeScale, ElasticSearch, Prometheus, Graphite, or message brokers including RabbitMQ, NATS, Kafka.
Glances alternatives
 GlanceSelf-hosted, open-source startpage dashboard that gathers RSS, YouTube, Reddit and server info into widgetized pages via one small Go binary or Docker container.CompareGlance with Glances
 simonSimon is a self-hosted, open-source system monitor in Rust with real-time metrics, Docker monitoring, file browser, and alerting via webhooks — all in a single binary.Comparesimon with Glances
 KulaSelf-hosted, open-source Linux server monitor in one Go binary: real-time web dashboard plus TUI, built-in ring-buffer storage, Prometheus export, app monitoring.CompareKula with Glances
 vigilVigil is a self-hosted terminal dashboard for Raspberry Pi that collects metrics, stores them in SQLite, and sends alerts via Discord, webhooks, or ntfy.sh.Comparevigil with Glances
 netdataNetdata is an open-source, self-hosted infrastructure monitoring platform with per-second metrics, automated dashboards, ML anomaly detection, and zero-config deployment.Comparenetdata with Glances
 NetProbe_PythonA containerized network monitor that checks connectivity, DNS response times, and bandwidth, then shows results in a dark-themed web dashboard with historical graphs.CompareNetProbe_Python with Glances
 StatusSelf-hosted, open-source system monitor for small Linux homeservers with web UI showing CPU, memory, storage, network, and host info. Runs on Raspberry Pi.CompareStatus with Glances
 checkmateSelf-hosted, open-source uptime and infrastructure monitor: HTTP, ping, DNS, Docker and gRPC checks with incidents, status pages and Slack or email alerts.Comparecheckmate with Glances
Should you self-host Glances?
Glances scores 76/100 on selfhost.directory (how scoring works) and ranks #12 of 105 in Monitoring & observability. It has 33 960 GitHub stars, +196 in the last 30 days.
It shipped 9 stable releases in the past year. The latest, v4.5.9, came out on 7 November 2026. New versions land roughly every 3 weeks.
Setup is moderate: expect some configuration beyond a single command. An official Docker image is available. It is LGPL-3.0-licensed and written mostly in Python.
Its closest alternative on selfhost.directory is prometheus (92/100, 67 639 stars). It scores higher overall, so compare the two before you pick. See Glances vs prometheus side by side.
Glances README


Important
The current stable release is Glances 4.5.9: see the v4.5.9 tag for its
source code and documentation. pip install glances installs it.
This branch (develop) contains Glances 5.0.0, currently in beta. For a quick comparaison between Glances 4 and Glances 5, have a look to this page. The rest of this page describes Glances 5.
Warning
Try Glances 5 (beta) — for testing only:
- it is a beta: expect bugs, and do not use it in production;
- the API is broken compared to Glances 4: the REST API moves from
/api/4to/api/5, the Python API is new, and a Glances 5 client only talks to a Glances 5 server (no XML-RPC anymore); - configuration files from Glances 4 are read, but some options changed.
Install the beta from TestPyPI in a dedicated virtual environment (dependencies still come from PyPI):
python3 -m venv ~/.venv-glances5
source ~/.venv-glances5/bin/activate
pip install --pre --index-url https://test.pypi.org/simple/ \
    --extra-index-url https://pypi.org/simple/ 'glances[web]>=5.0.0b1'
glances --version
Or run the nicolargo/glances:dev Docker image (built from this branch).
Please report what you find in the GitHub issues.
FAQ
I cannot reach the Web UI from another machine?
Start the server with -B 0.0.0.0 or bind_address=0.0.0.0 to listen on all interfaces.
Webserver display a blank screen on Debian/Ubuntu?
Install from PyPI or use Docker images which include the Web UI static files.
Container memory stats not displayed?
On ARM64, Docker needs cgroup_enable=memory added to /boot/firmware/cmdline.txt.
Any encoding issue?
Try running Glances with LANG=en_US.UTF-8 LC_ALL set.
More in Monitoring & observability
 GoAccessOpen-source real-time web log analyzer for system administrators. Analyzes Apache, Nginx, S3 logs to generate live HTML dashboards or terminal reports.
 GPU-HotGPU Hot is a self-hosted, open-source web dashboard for real-time NVIDIA GPU monitoring with sub-second metrics, multi-GPU support, and cluster aggregation via hub mode.
 grafanaGrafana is a self-hosted, open-source observability platform for querying, visualizing, and alerting on telemetry data from many sources.
 Grafana-Image-RendererSelf-hosted backend service using headless Chromium to render Grafana panels as PNG, PDF, or CSV for sharing and alerts.
 Grafana LokiGrafana Loki is a self-hosted, open-source log aggregation system that indexes metadata instead of full log text for cost-effective operation.
 GrafanaMimirOpen-source, self-hosted long-term TSDB for Prometheus: multi-tenant, replicated metrics storage that scales past a billion active series.
 greptimedbSelf-hosted and open-source: one Rust columnar telemetry store keeps metrics, logs and traces in a single engine with SQL or PromQL queries over object storage.
 GumCPGumCP is a self-hosted, open-source Raspberry Pi web control panel with system monitoring, GPIO control, and command buttons with an HTTP API.
 HealthchecksOpen-source, self-hosted cron job and background task monitor: each job pings a unique URL, and alerts fire over 25+ integrations when a heartbeat is late.
 hearthSelf-hosted observability dashboard for home AI clusters monitoring vLLM, llama.cpp, SGLang, Ollama, LiteLLM with real metrics and training observability.
 HeatBlockHeatBlock is a self-hosted, open-source Minecraft server status checker with a REST API and web UI for Java and Bedrock servers.
 heliconeHelicone is a self-hosted, open-source LLM observability platform and AI gateway for 100+ models with cost tracking, agent tracing, prompt management, and a playground.
0 comments