
Self-host Kula
0.21.0Zero-dependency Linux server monitor with web dashboard
docker run -d --name kula --pid host --network host -v /proc:/proc:ro -v kula_data:/app/data c0m4r/kula:latest- Stars
- 1 338
- Port
- 27960 (Web dashboard/API/metrics listener)
c0m4r/kula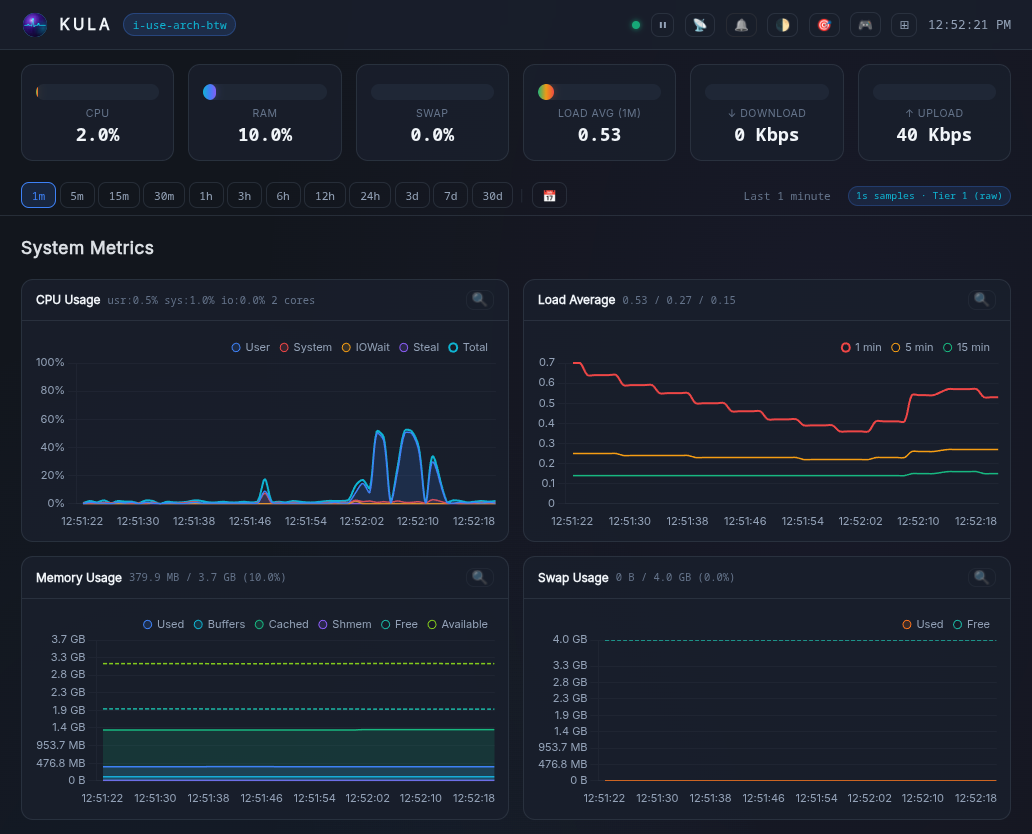
What is Kula?
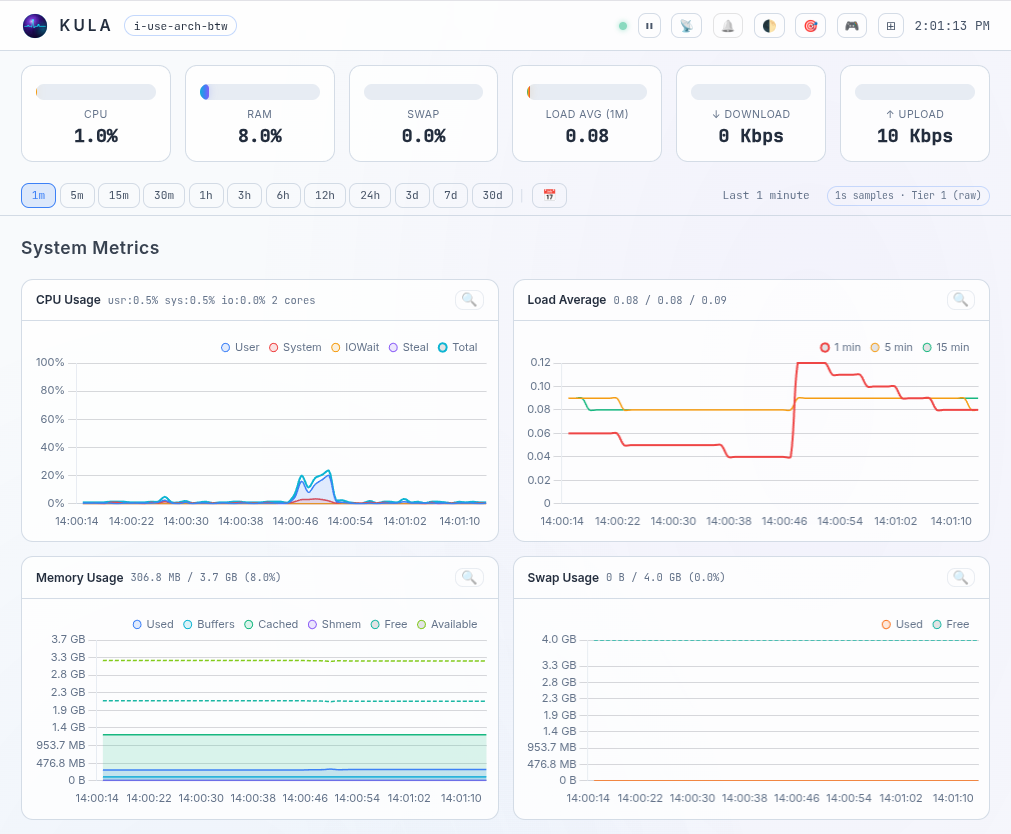
Kula is a lightweight Linux server monitor for people who want metrics on their own machine without running a stack. A single Go binary reads /proc and /sys every second and keeps history in fixed-size ring-buffer files: raw 1-second samples plus 1-minute and 5-minute rollups, with no database involved. The WebSocket-driven web dashboard runs on port 27960 and offers live charts with zoom, gauges, a hardware/system-info page, light or dark themes and 26 UI languages; the terminal UI brings the same data to an SSH session and can also plot past samples.
Covered metrics include CPU, GPU, load, memory, swap, network, disk I/O, temperatures, battery, processes and Kula's own footprint. Optional modules watch nginx, Apache2, PostgreSQL, MySQL/MariaDB, Docker/Podman/cgroup containers, and user-defined custom metrics pushed over a Unix socket. A Prometheus endpoint lets you scrape it into an existing stack, and an optional AI chat runs against a local Ollama instance. Login is optional and hashes passwords with Argon2id, supporting several users. Kula also sandboxes itself with Landlock and adds protective headers, origin checks and request throttling; it never phones home, so it works on air-gapped hosts.
Install via a guided bash script, a standalone tarball, .deb, .rpm, the AUR, a Snap, or the c0m4r/kula Docker image; scheduled tier backups are configurable. Releases are pre-1.0 (0.x) but frequent. Licensed AGPL-3.0.
Should you self-host Kula?
Kula scores 55/100 on selfhost.directory (how scoring works) and ranks #16 of 51 in Monitoring & observability. It has 1 338 GitHub stars.
It shipped 10 stable releases in the past year. The latest, 0.21.0, came out on 30 September 2026. New versions land roughly every 3 days.
Setup is easy: most people get it running in one sitting. An official Docker image is available. It is AGPL-3.0-licensed and written mostly in Go.
Its closest alternative on selfhost.directory is GoAccess (75/100, 21 092 stars). It scores higher overall, so compare the two before you pick. See Kula vs GoAccess side by side.
Features
- AI Assistant
- Application monitoring
- Built-in tiered storage
- Container Monitoring
- Custom metrics
- GPU MonitoringNVIDIA may need extra setup per the troubleshooting docs.
- Landlock sandbox
- Multi-language UI
- Prometheus Exporter
- Real-time web dashboard
- Scheduled Backups
- Terminal UI
- User Authentication
- Zero external calls
Kula README
More in Metrics
 MonitorixSelf-hosted, open-source monitoring daemon for Linux and BSD servers that charts system, network, sensor and service statistics in a built-in web interface.
 monoscopeOpen-source, self-hosted observability that keeps logs, metrics and traces in your own S3 buckets, with plain-English queries, scheduled AI agents and session replay.
 muninOpen-source, self-hosted infrastructure monitor: a master polls nodes every five minutes, stores data in RRD files, and draws graphs in a web UI with 500+ plugins.
 pcpPerformance Co-Pilot (PCP) is an open-source, self-hosted framework for system-level performance monitoring across distributed systems.
 prometheusPrometheus is a self-hosted, open-source monitoring toolkit that pulls metrics via HTTP, stores them locally, and uses PromQL for powerful queries and alerting.
 statsdA self-hosted, open-source network daemon that aggregates counters, timers, and gauges sent over UDP or TCP, forwarding them to pluggable backends like Graphite.
 TelegrafOpen-source, self-hosted telemetry agent that collects, processes and writes metrics and logs via 300+ plugins, shipped as a single static binary configured in TOML.
 UniFi-PollerThis open-source, self-hosted poller gathers UniFi controller data every 30 seconds and feeds InfluxDB, Prometheus or Loki, with thirteen ready-made Grafana dashboards.
 vectorA self-hosted, open-source observability data pipeline in Rust that collects, transforms, and routes logs and metrics to whichever backend you choose.
 victoriametricsOpen-source, self-hosted time series database and monitoring backend that replaces Prometheus or Graphite as Grafana's metrics store, with PromQL and MetricsQL querying.
 AlloySelf-hosted OpenTelemetry Collector with Prometheus pipelines. Programmable pipelines, clustering, Loki/Tempo/Mimir/Pyroscope integrations.
 BeszelOpen-source, self-hosted server monitoring: a hub plus per-host agents tracking CPU, memory, disks, containers, GPU and temperatures, with alerts and historical data.
0 comments