
Self-host Status
Lightweight web-based system monitor for Linux homeservers
- Stars
- 317
- Port
- 9090 (Web UI and API)
What is Status?
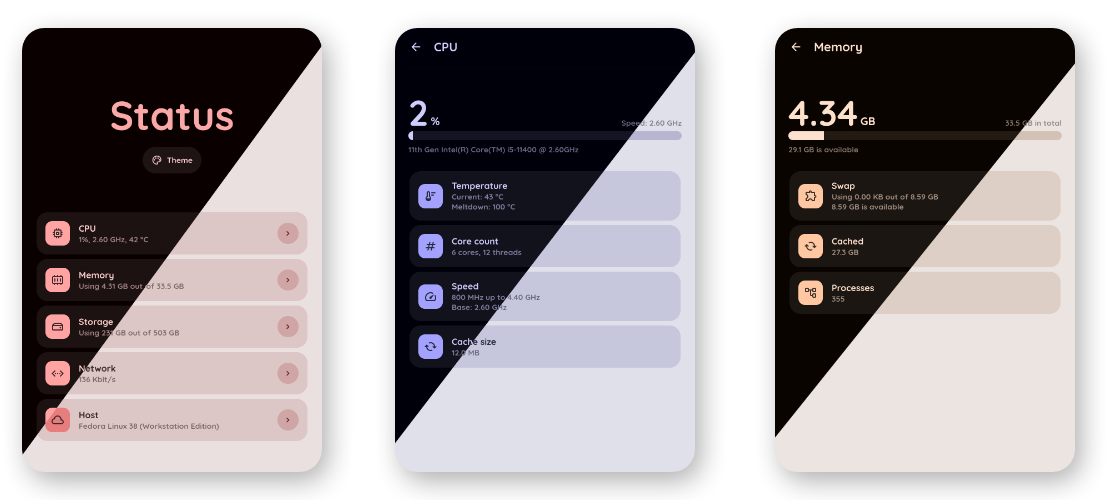
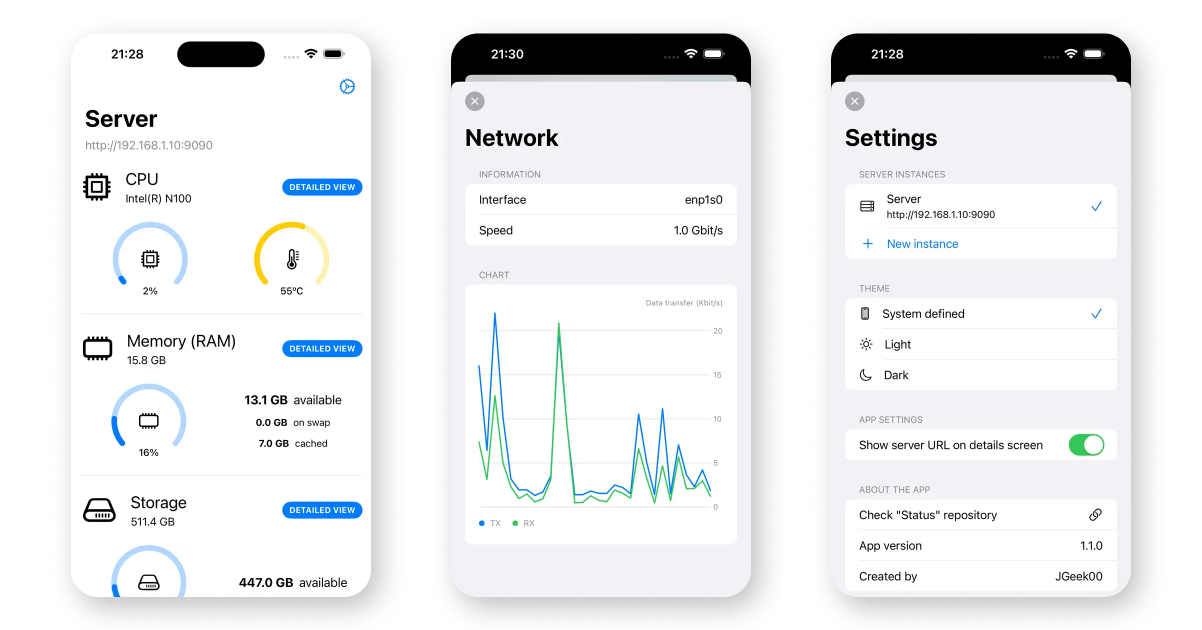
Status is a web-based system monitoring tool built for small Linux homeservers. It reads from virtual filesystems like /proc and /sys to show real-time CPU usage, temperatures, frequencies, memory and swap consumption, storage device usage, network traffic, and host details such as OS version, uptime, and load averages. The interface includes a dark mode that follows the system theme. You can run it via Docker Compose or on bare metal with a Python virtual environment. It works on Raspberry Pis, mini PCs, and regular desktops. The project is in maintenance mode with only bug fixes planned, while a Go rewrite called Statee is under development.
Should you self-host Status?
Status scores 45/100 on selfhost.directory (how scoring works) and ranks #37 of 51 in Monitoring & observability. It has 317 GitHub stars.
There was no stable release in the past 12 months, so check the repository's recent activity before you rely on it.
Setup is moderate: expect some configuration beyond a single command. It is MIT-licensed and written mostly in Python.
Its closest alternative on selfhost.directory is GoAccess (75/100, 21 093 stars). It scores higher overall, so compare the two before you pick. See Status vs GoAccess side by side.
Features
- CPU Monitoring
- Host information
- Memory monitoring
- Network Monitoring
- Raspberry Pi Support
- REST API
- Storage monitoring
Status README
More in Monitoring & observability
 tianjiSelf-hosted insight hub combining web analytics service monitoring and server status checks. Apache 2.0 licensed open-source platform for independent developers.
 tirrenoA self-hosted PHP security framework that spots account takeovers, fraud, and logic abuse inside your app using a dashboard, rule engine, and audit trails.
 tracearr-supervisedSelf-hosted, open-source monitoring dashboard for Plex, Jellyfin and Emby with real-time streams, account-sharing detection, trust scores and automations.
 TraceloopOpen-source observability for your GenAI or LLM application, based on OpenTelemetry
 World MonitorSelf-hosted open-source dashboard streaming 460 news feeds from 761 providers onto a live map with 57 layers, correlating geopolitics, markets, shipping, aviation
 ZabbixZabbix is a self-hosted, open-source observability platform for monitoring networks, servers, VMs, and cloud infrastructure with distributed monitoring.
 AlertaSelf-hosted, open-source alert monitoring console that consolidates, de-duplicates and correlates alerts from many sources via an HTTP JSON API.
 app-glancesGlances is a self-hosted, open-source system monitoring tool packaged as a Home Assistant add-on with web dashboard and InfluxDB export.
 crowdsec-web-uiSelf-hosted dashboard for CrowdSec to explore alerts, manage decisions, view metrics, and configure multi-channel notifications.
 elasticsearchOpen-source distributed search engine that handles structured, unstructured, and vector data for real-time search, observability, and AI workloads.
 gatusSelf-hosted, open-source uptime monitor and status page: probe HTTP, TCP, ICMP or DNS endpoints with custom conditions and alert via Slack, Discord, PagerDuty, etc.
 GPONSelf-hosted Prometheus exporter scraping ~75 metrics from Realtek RTL960x GPON SFP ONUs over SSH, with pre-built Grafana dashboard.
0 comments