
Self-host gatus
v5.38.0Developer-focused uptime monitor and status page
docker run -p 8080:8080 --name gatus ghcr.io/twin/gatus:stable- Stars
- 12 810
- Port
- 8080 (Web dashboard, API, metrics and badges (configurable via web.port))
ghcr.io/twin/gatus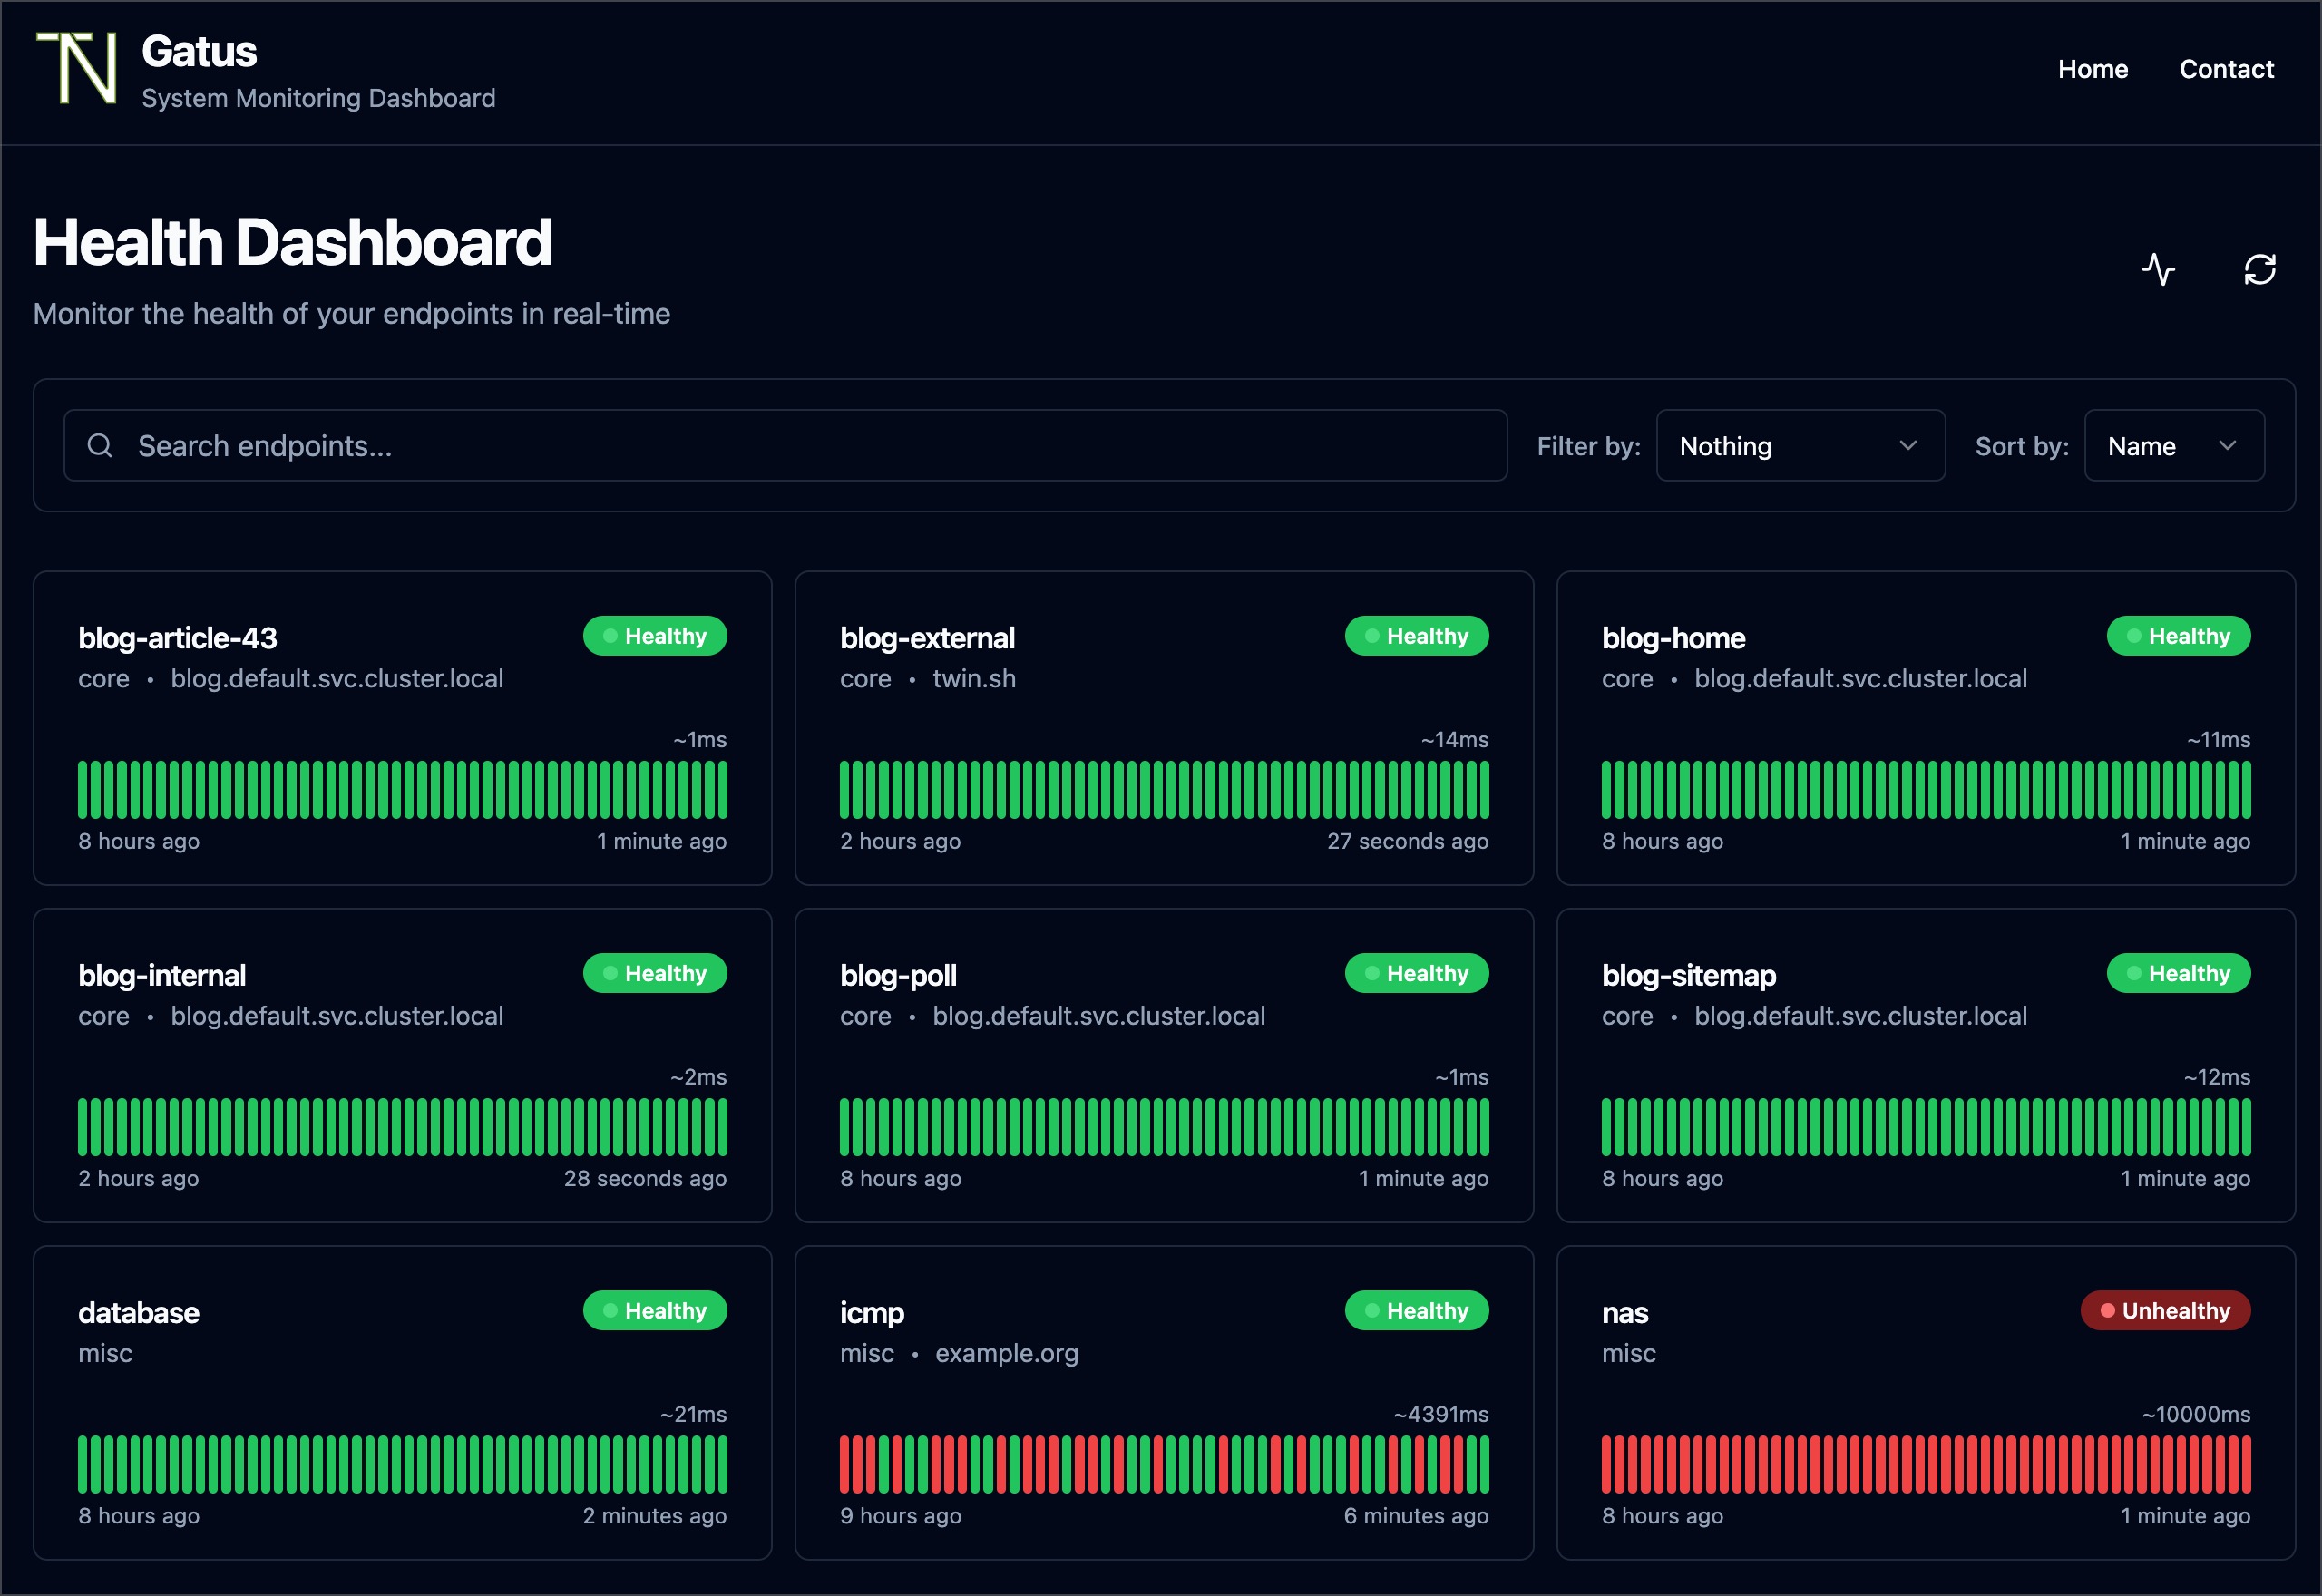
What is gatus?
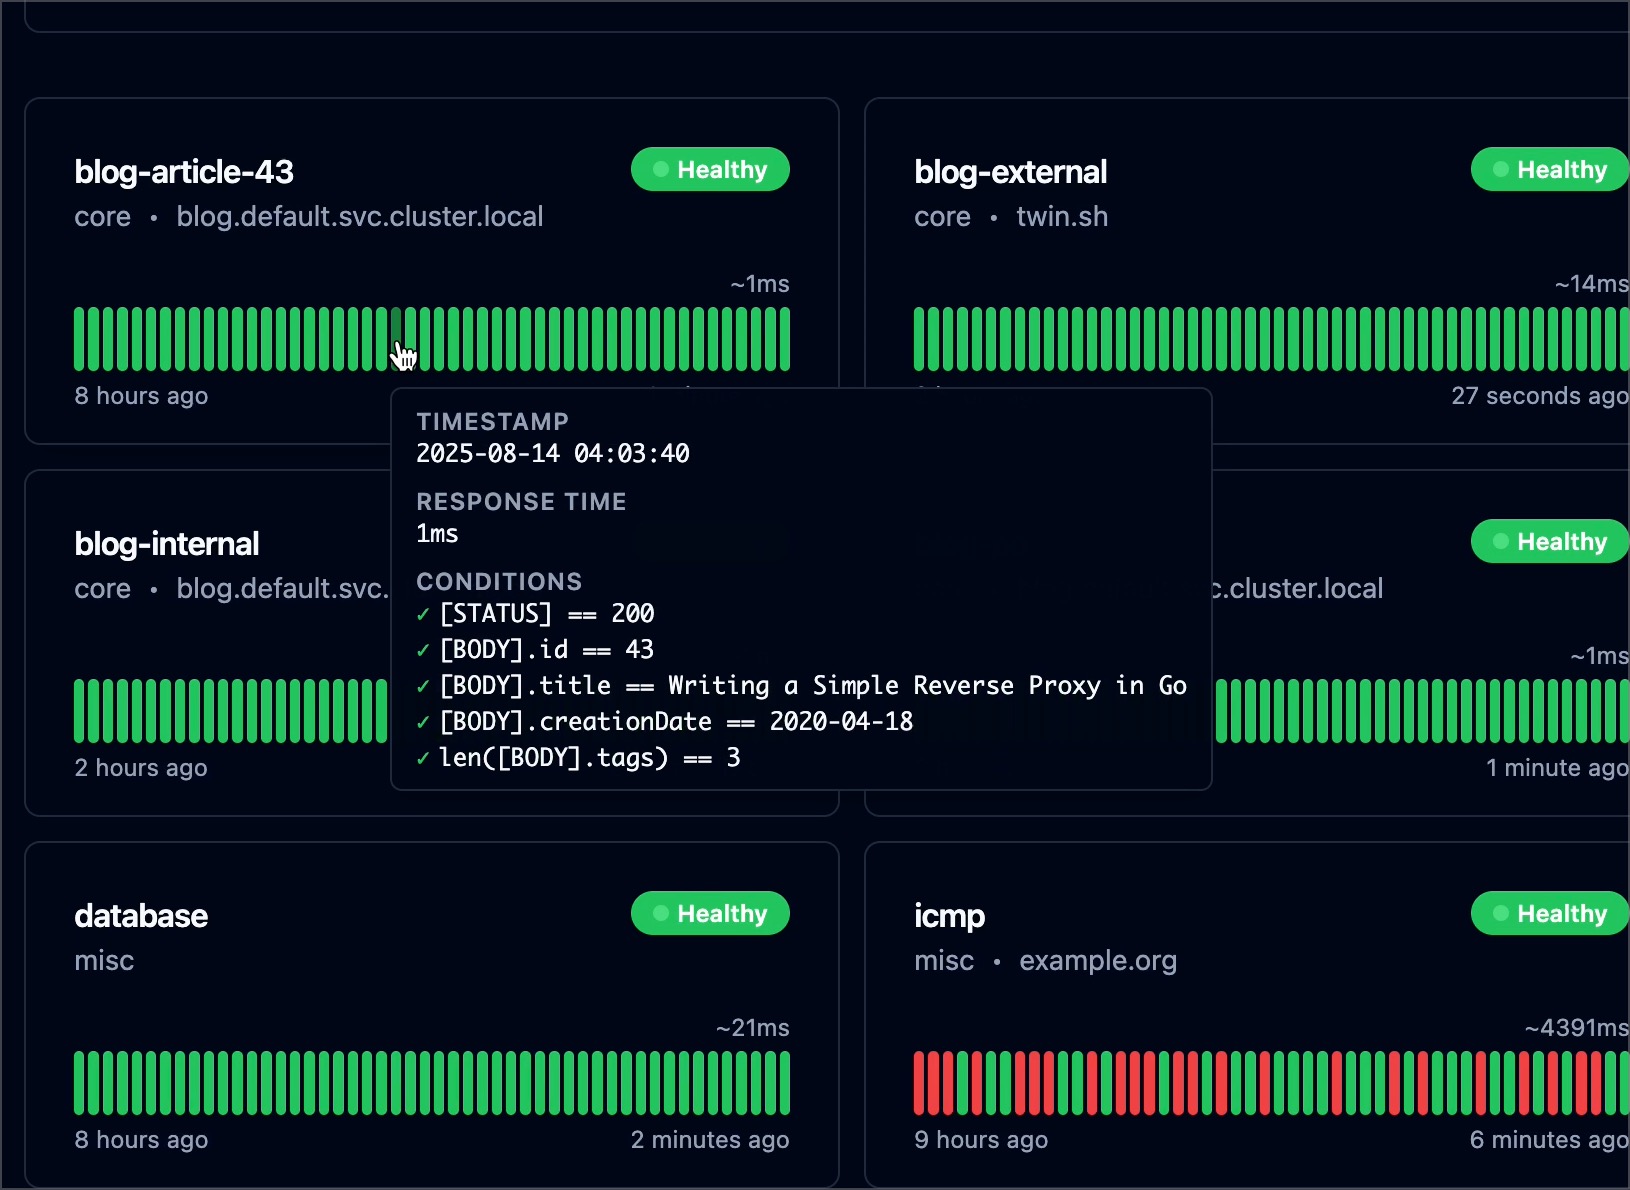
Gatus is an Apache-2.0 health dashboard and status page written in Go: you declare endpoints in a YAML file, poll them over HTTP(S), TCP, UDP, ICMP, DNS, gRPC, SSH or TLS, and evaluate assertions on the status code, response body, response time or certificate expiry. When a condition fails it can fire alerts through roughly thirty providers (Slack, Discord, Teams, PagerDuty, Twilio, Telegram, Opsgenie and more), and you can also point it at your own webhook for custom actions. The dashboard doubles as a public status page with endpoint groups, maintenance windows, announcements, SVG uptime and response-time badges, a read-only JSON API and optional Prometheus metrics at /metrics. Self-hosting is a single container (ghcr.io/twin/gatus or twinproduction/gatus on port 8080) with a mounted config.yaml, or the author's Helm chart and Terraform module for Kubernetes; state lives in memory, SQLite or PostgreSQL. Login is optional via HTTP basic auth or OIDC. Note that suites are marked ALPHA and remote instances EXPERIMENTAL in the docs, and the vendor also sells a managed Gatus.io service.
gatus alternatives
 maintenantSelf-hosted monitoring auto-discovering Docker, Swarm, and Kubernetes containers, endpoints, TLS certs, cron jobs, and host resources from one Go binary (~100MB).Comparemaintenant with gatus
 homarr-iframesSelf-hosted Go API generating embeddable iFrames for 17+ services like Linkwarden, Vikunja, Overseerr, Sonarr, Radarr, Uptime Kuma — works in any dashboard.Comparehomarr-iframes with gatus
 kenerAn open-source, self-hosted status page and uptime monitor: 11 monitor types, incidents, maintenance windows, subscriber alerts and OIDC login.Comparekener with gatus
 VigilOpen-source, self-hosted status page that probes HTTP, TCP, SSH and ICMP services, publishes announcements, and alerts via Slack, Twilio SMS, email, Telegram and more.CompareVigil with gatus
 NimbusNimbus is a self-hosted, open-source homelab dashboard for monitoring services with real-time health checks, multi-user auth, widgets, and app integrations.CompareNimbus with gatus
 lab-dashSelf-hosted dashboard for managing homelab applications with customizable grid layout, service health checks, and PWA support.Comparelab-dash with gatus
 corootSelf-hosted, open-source APM and observability platform where eBPF agents capture every telemetry signal without code changes, with service maps and SLO alerting.Comparecoroot with gatus
 monoscopeOpen-source, self-hosted observability that keeps logs, metrics and traces in your own S3 buckets, with plain-English queries, scheduled AI agents and session replay.Comparemonoscope with gatus
All self-hosted alternatives to AWS CloudWatch → All self-hosted alternatives to Prometheus Alertmanager → All self-hosted alternatives to Splunk →
Should you self-host gatus?
gatus scores 78/100 on selfhost.directory (how scoring works) and ranks #1 of 12 in Uptime Monitoring. It has 12 810 GitHub stars, +510 in the last 30 days.
It shipped 7 stable releases in the past year. The latest, v5.38.0, came out on 28 October 2026. New versions land roughly every 6 weeks.
Setup is easy: most people get it running in one sitting. An official Docker image is available. It is Apache-2.0-licensed and written mostly in Go.
Its closest alternative on selfhost.directory is openobserve (79/100, 23 085 stars). It scores higher overall, so compare the two before you pick. See gatus vs openobserve side by side.
Features
- Alert notifications
- Custom alerting provider
- Custom health check conditions
- Domain expiration monitoring
- Endpoint groups
- Health dashboard / status page
- Hot configuration reload
- Maintenance Windows
- Multi-protocol health checks
- Prometheus Metrics
- Push-based external endpoints
- Read-only REST API
- Sequential test suitesDocumented as ALPHA.
- Status page announcements
- Uptime and response time badges
gatus README


Gatus is a developer-oriented health dashboard that gives you the ability to monitor your services using HTTP, ICMP, TCP, and even DNS queries as well as evaluate the result of said queries by using a list of conditions on values like the status code, the response time, the certificate expiration, the body and many others. The icing on top is that each of these health checks can be paired with alerting via Slack, Teams, PagerDuty, Discord, Twilio and many more.
FAQ
Can Gatus be exposed on a custom path such as example.org/status?
No; the UI can be served from a fully qualified domain name but does not support path-based routing.
How to change the color thresholds of the response time badge?
Define ui.badge.response-time.thresholds on the endpoint with five values in milliseconds, covering Awesome, Great, Good, Passable and Bad.
How to fix the 431 Request Header Fields Too Large error?
The request headers reaching Gatus are too large (e.g. big cookies); raise web.read-buffer-size above its default of 8192.
How do I sort by group by default?
Set ui.default-sort-by to group. If you previously sorted the dashboard by another field, the default only applies after clearing the browser's local storage.
Why would I use Gatus when I can just use Prometheus' Alertmanager, Cloudwatch or even Splunk?
Metric-based alerting only fires when there is traffic to produce errors, so a failure with no active clients goes unnoticed. Gatus runs your own health checks instead, letting you be alerted before clients are affected.
More in Uptime Monitoring
 HealthchecksOpen-source, self-hosted cron job and background task monitor: each job pings a unique URL, and alerts fire over 25+ integrations when a heartbeat is late.
 hertzbeatApache HertzBeat is a self-hosted, open-source observability system unifying agentless metrics and logs collection, alerting, and notification dispatch.
- kenerAn open-source, self-hosted status page and uptime monitor: 11 monitor types, incidents, maintenance windows, subscriber alerts and OIDC login.
 Kuvasz UptimeSelf-hosted, open-source uptime & SSL monitor with HTTP, ping, TCP, DNS and Docker checks, status pages, maintenance windows, REST API, and Prometheus export.
 logtideOpen-source, self-hosted log management and SIEM unifying logs, traces and metrics on TimescaleDB, ClickHouse or MongoDB, an alternative to Datadog, Splunk and ELK.
 NezhaOpen-source, self-hosted server and website monitor: a dashboard plus agents track host metrics, HTTP/TCP/ping checks, SSL certs, alerts and a web terminal.
 peekapingOpen-source, self-hosted uptime monitor in Go and React: HTTP, TCP, ping, DNS and database checks, status pages, 20+ alert channels, 2FA and a REST API.
 phpservermonSelf-hosted, open-source uptime monitor that checks websites and TCP ports from your own PHP server, with cron jobs, graphs and email, SMS or Telegram alerts.
 Statping-ngA self-hosted, open-source status page and uptime monitor in Go. It checks HTTP, socket and gRPC endpoints, alerts via Slack, Discord or email, and supports oAuth logins.
 statusnookSelf-hosted status page with HTTP endpoint monitoring, incident timelines, and Slack/SMTP notifications.
 UpptimeOpen-source, self-hosted uptime monitor and status page that runs entirely on GitHub Actions, Issues and Pages, checking endpoints every 5 minutes with no server.
 upstatSelf-hosted open-source uptime monitor with HTTP(S) checks, latency charts, status pages, and alerts via Discord, Slack, email, webhooks. SQLite/PostgreSQL.
0 comments