
Self-host openobserve
v1.2.0-rc1Unified observability for logs, metrics, traces, and RUM
- Stars
- 22 973
- Ports
- 5080 (HTTP API and web UI), 5081 (gRPC API)
public.ecr.aws/zinclabs/openobserve


What is openobserve?
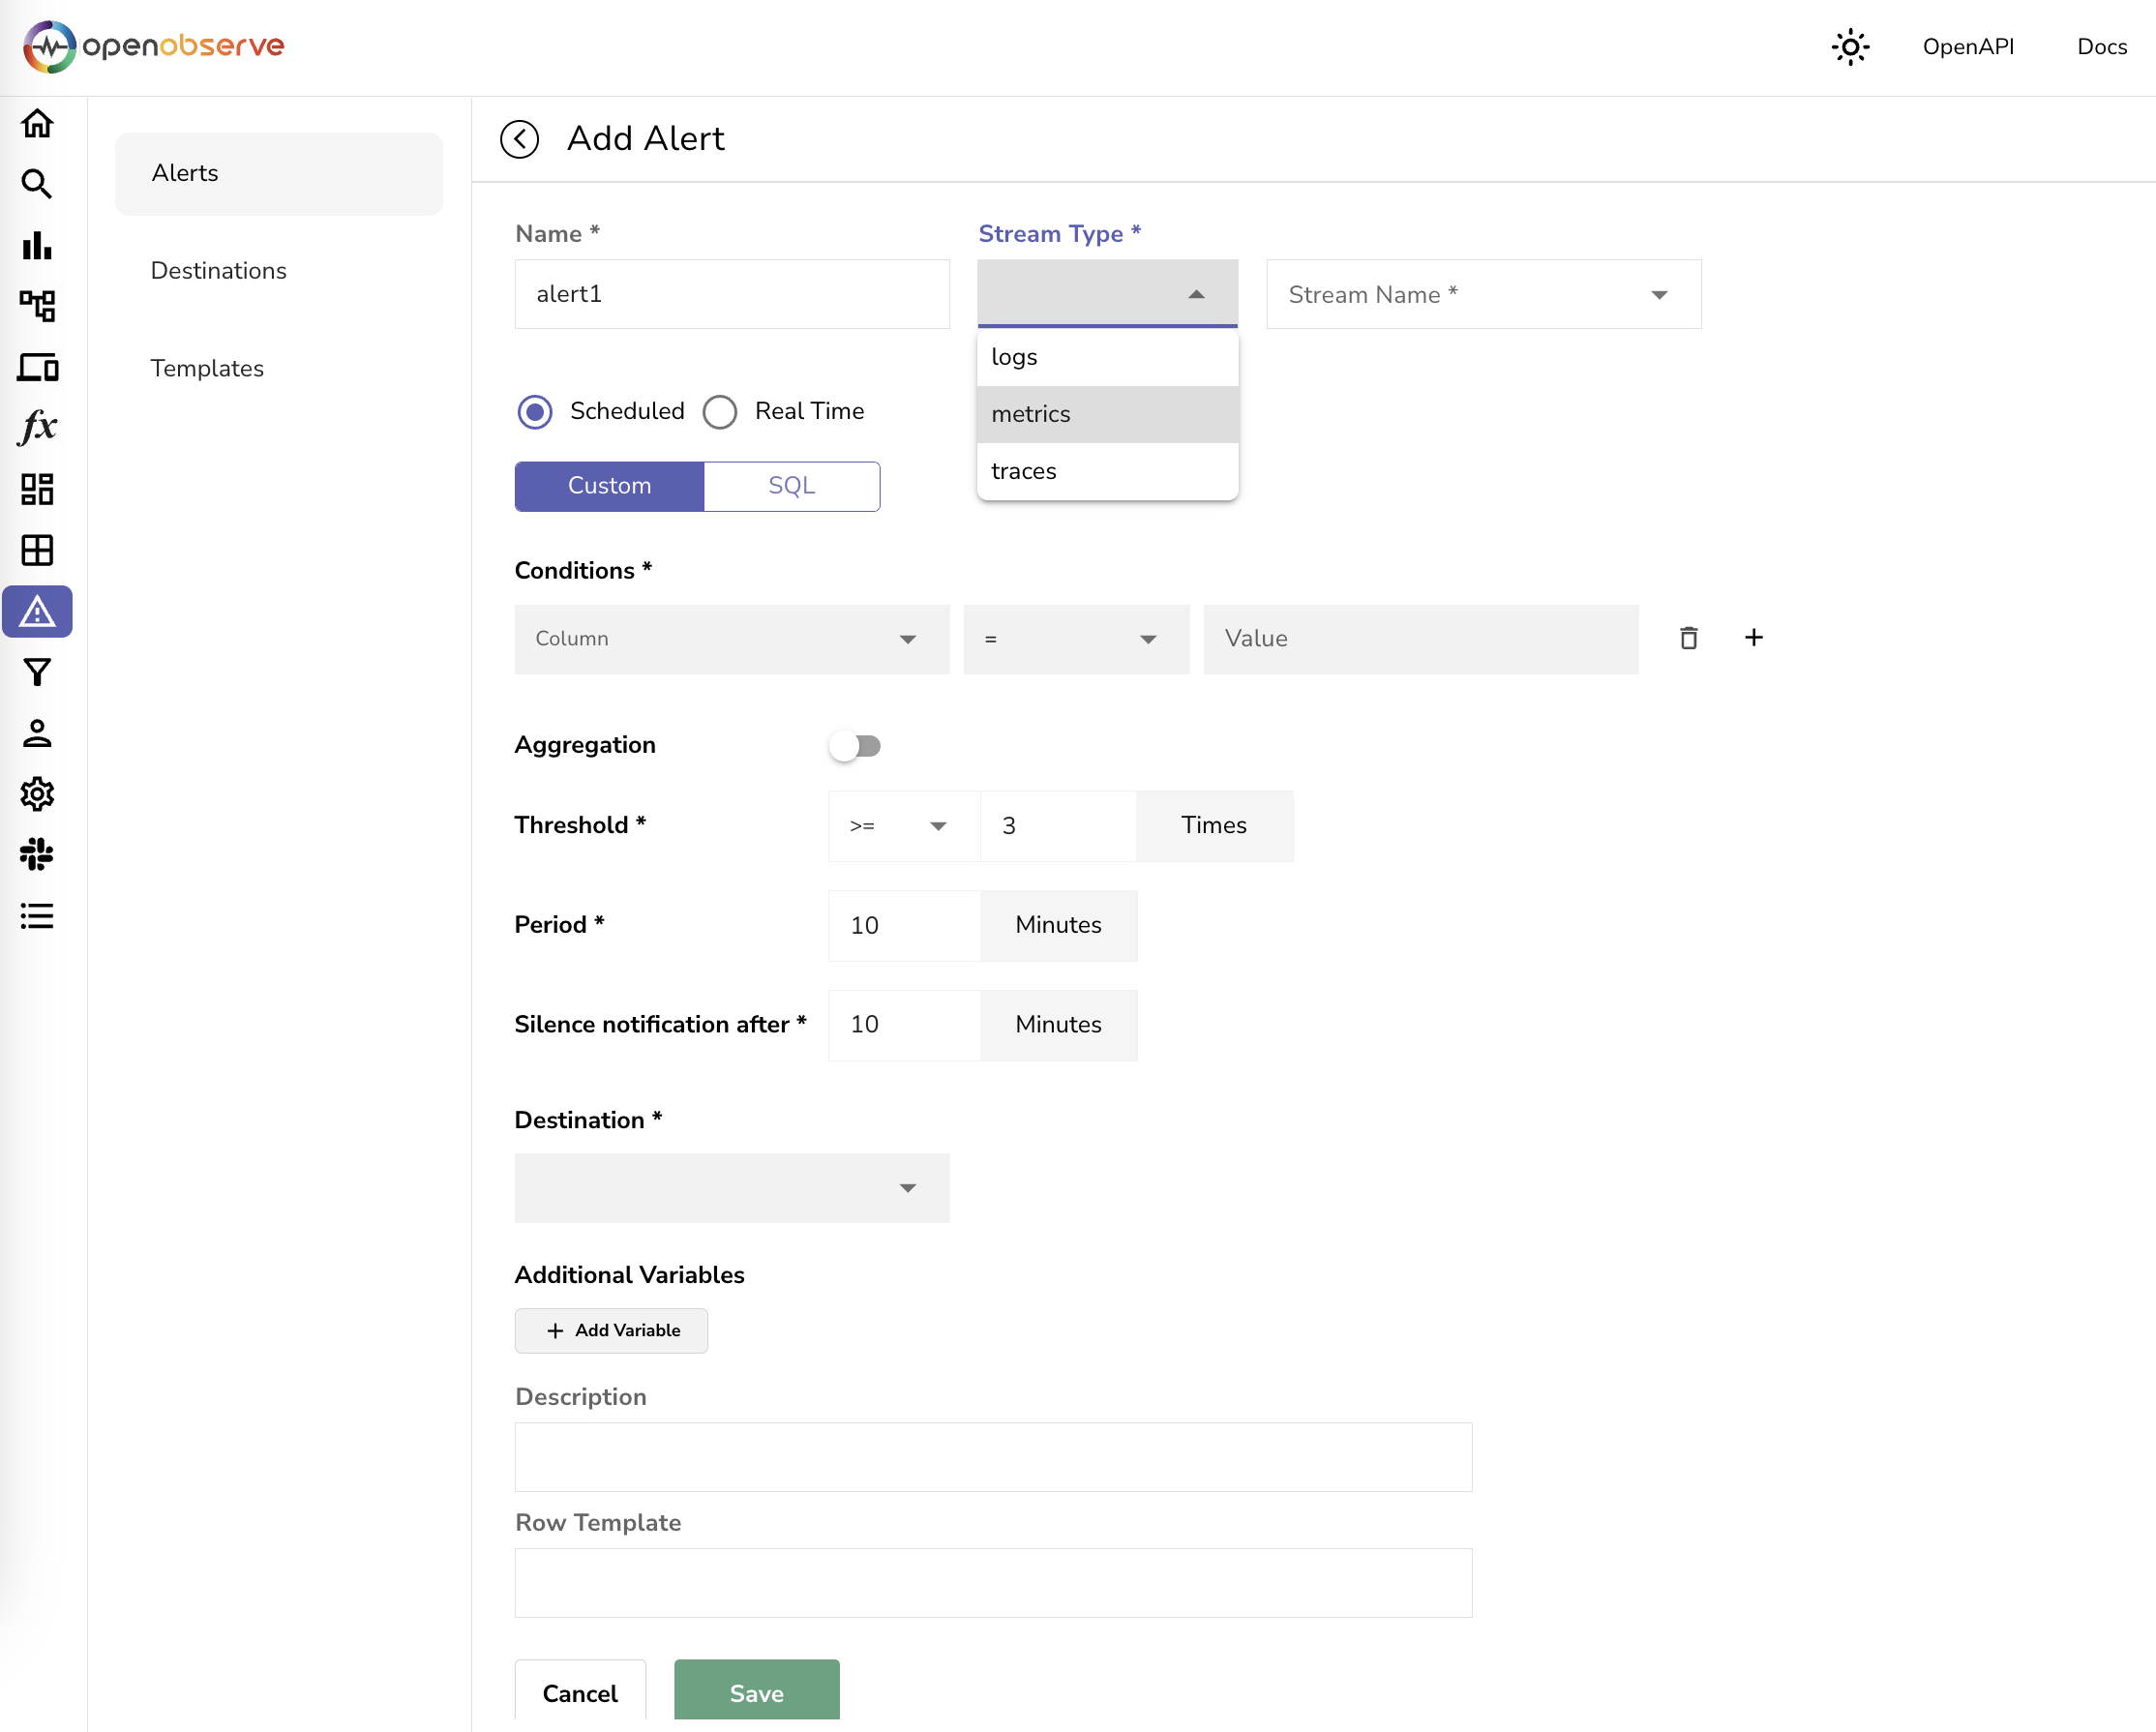
This cloud-native observability platform built in Rust combines logs, metrics, traces, Real User Monitoring, session replay, dashboards, alerts, incidents, data pipelines, and AI/LLM observability into one product. It uses Parquet columnar storage with an S3-native architecture to achieve dramatically lower storage costs compared to Elasticsearch. The platform supports both single-node deployments using SQLite and local disk or object storage, and high-availability clustered deployments on Kubernetes with NATS, PostgreSQL, and object storage. It natively ingests OpenTelemetry data and queries logs and traces with SQL and metrics with PromQL. The open-source edition is AGPL-3.0 licensed and feature-complete for production use, while an Enterprise edition adds SSO (OIDC, SAML, LDAP), advanced RBAC, audit trails, federated search, and dedicated support. Self-hosting options include Docker, binary downloads for Linux, macOS, and Windows, Kubernetes manifests, or Helm charts.
openobserve alternatives
 laminarOpen-source observability platform for AI agents. Alternative to LangSmith with tracing, Signals failure detection, evals, dashboards, MCP/CLI access.Comparelaminar with openobserve
 quickwitOpen-source self-hosted search engine for observability: full-text search and aggregations on logs and traces in S3 or MinIO, with an Elasticsearch-compatible API.Comparequickwit with openobserve
 OpenSREOpenSRE is a self-hosted, open-source AI SRE agent that autonomously investigates incidents, learns via episodic memory, and maps service topology with Neo4j.CompareOpenSRE with openobserve
 Apache SkyWalkingOpen-source, self-hosted APM platform for cloud-native systems: tracing, metrics, logs, profiling and alerting on pluggable storage such as BanyanDB.CompareApache SkyWalking with openobserve
 vectorA self-hosted, open-source observability data pipeline in Rust that collects, transforms, and routes logs and metrics to whichever backend you choose.Comparevector with openobserve
 heliconeHelicone is a self-hosted, open-source LLM observability platform and AI gateway for 100+ models with cost tracking, agent tracing, prompt management, and a playground.Comparehelicone with openobserve
 RustrakRustrak is a self-hosted, open-source error tracker compatible with Sentry SDKs. Change one config line to send data to your own infrastructure.CompareRustrak with openobserve
 OpenAnalyticsOpen-source, cookieless web analytics with realtime dashboards, funnels and revenue attribution, self-hosted via Docker Compose on Postgres and ClickHouse.CompareOpenAnalytics with openobserve
All self-hosted alternatives to Datadog → All self-hosted alternatives to Splunk → All self-hosted alternatives to Elasticsearch →
Should you self-host openobserve?
openobserve scores 80/100 on selfhost.directory (how scoring works) and ranks #7 of 105 in Monitoring & observability. It has 22 973 GitHub stars, +692 in the last 30 days.
It shipped 22 stable releases in the past year. The latest, v1.1.2, came out on 20 October 2026. New versions land roughly every 5 days.
Setup is moderate: expect some configuration beyond a single command. An official Docker image is available. It is AGPL-3.0-licensed and written mostly in Typescript.
Its closest alternative on selfhost.directory is netdata (86/100, 81 345 stars). It scores higher overall, so compare the two before you pick. See openobserve vs netdata side by side.
Features
- AI Assistant
- AI/LLM observability
- Alerts
- Dashboards
- Data Pipelines
- Distributed Tracing
- Incidents
- Log Management
- Metrics
- Real User Monitoring (RUM)
- Service Graph
- SLOs
- SQL + PromQL query
- Synthetic monitoring
openobserve README
Open source Datadog alternative for logs, metrics, traces, and frontend monitoring. Modern observability platform: 10x easier, 140x lower storage cost, high performance, petabyte scale.
FAQ
Is there a steep learning curve?
No. OpenObserve uses familiar query languages (SQL for logs/traces, PromQL for metrics), has an intuitive GUI with drag-and-drop dashboard builder, and requires no complex tuning like Elasticsearch shards or heap sizes.
How does query performance compare to Elasticsearch?
OpenObserve delivers better performance than Elasticsearch for most workloads, with faster search and significantly faster analytics while using about a quarter of the hardware.
Is this production-ready?
Yes, OpenObserve runs in production across thousands of deployments worldwide, including environments processing in excess of 2 PB/day.
What are the limitations?
All data in OpenObserve is immutable — once ingested, it cannot be modified or deleted (only entire retention periods can be dropped). This is by design for logs and compliance use cases.
How does OpenObserve achieve 140x lower storage costs?
Through a combination of Parquet columnar storage (efficient compression) and an S3-native architecture (inexpensive object storage).
More in Application Performance Monitoring
 pyroscopeOpen-source, self-hosted continuous profiling platform: ingest CPU/memory profiles via SDKs, Alloy or eBPF, store in object storage and query flame graphs in Grafana.
 rivetRivet is an open-source, self-hostable orchestrator for AI agents, workflows, and sandboxes as lightweight Actors with SQLite and realtime.
- RustrakRustrak is a self-hosted, open-source error tracker compatible with Sentry SDKs. Change one config line to send data to your own infrastructure.
 sentrySelf-hosted error tracking and APM platform for developers to detect, trace, and fix production issues. Open-source under Fair Source license.
 Sentry Self-HostedSelf-hosted Sentry: the error monitoring platform as a Docker Compose stack of web, workers, Kafka, ClickHouse and PostgreSQL, aimed at low-volume deployments.
 SeqSeq is a self-hosted log server for structured logs, traces, and metrics with real-time search, alerting, and AI integration.
 signozOpen-source observability tool you host yourself, combining APM, logs, traces, and dashboards on OpenTelemetry to replace DataDog.
 StatLiteSelf-hosted monitoring for Spring Boot, Quarkus, Micronaut. Single Go binary, SQLite storage, built-in dashboard — no Prometheus/Grafana needed.
 uptraceSelf-hosted open-source APM unifying OpenTelemetry traces, metrics, logs in one platform. Replaces Datadog/New Relic at lower cost with ClickHouse for billions of spans.
 ZabbixZabbix is a self-hosted, open-source observability platform for monitoring networks, servers, VMs, and cloud infrastructure with distributed monitoring.
- Apache SkyWalkingOpen-source, self-hosted APM platform for cloud-native systems: tracing, metrics, logs, profiling and alerting on pluggable storage such as BanyanDB.
 corootSelf-hosted, open-source APM and observability platform where eBPF agents capture every telemetry signal without code changes, with service maps and SLO alerting.
0 comments