
Self-host StatLite
v0.7.0Lightweight self-hosted app monitoring with SQLite history
- Stars
- 189
- Port
- 9090 (HTTP dashboard and API)
docker.io/pvrlabs/statlite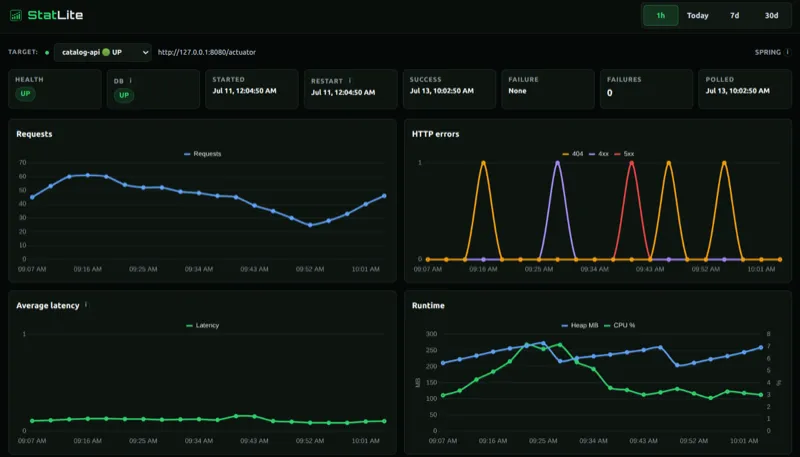
What is StatLite?
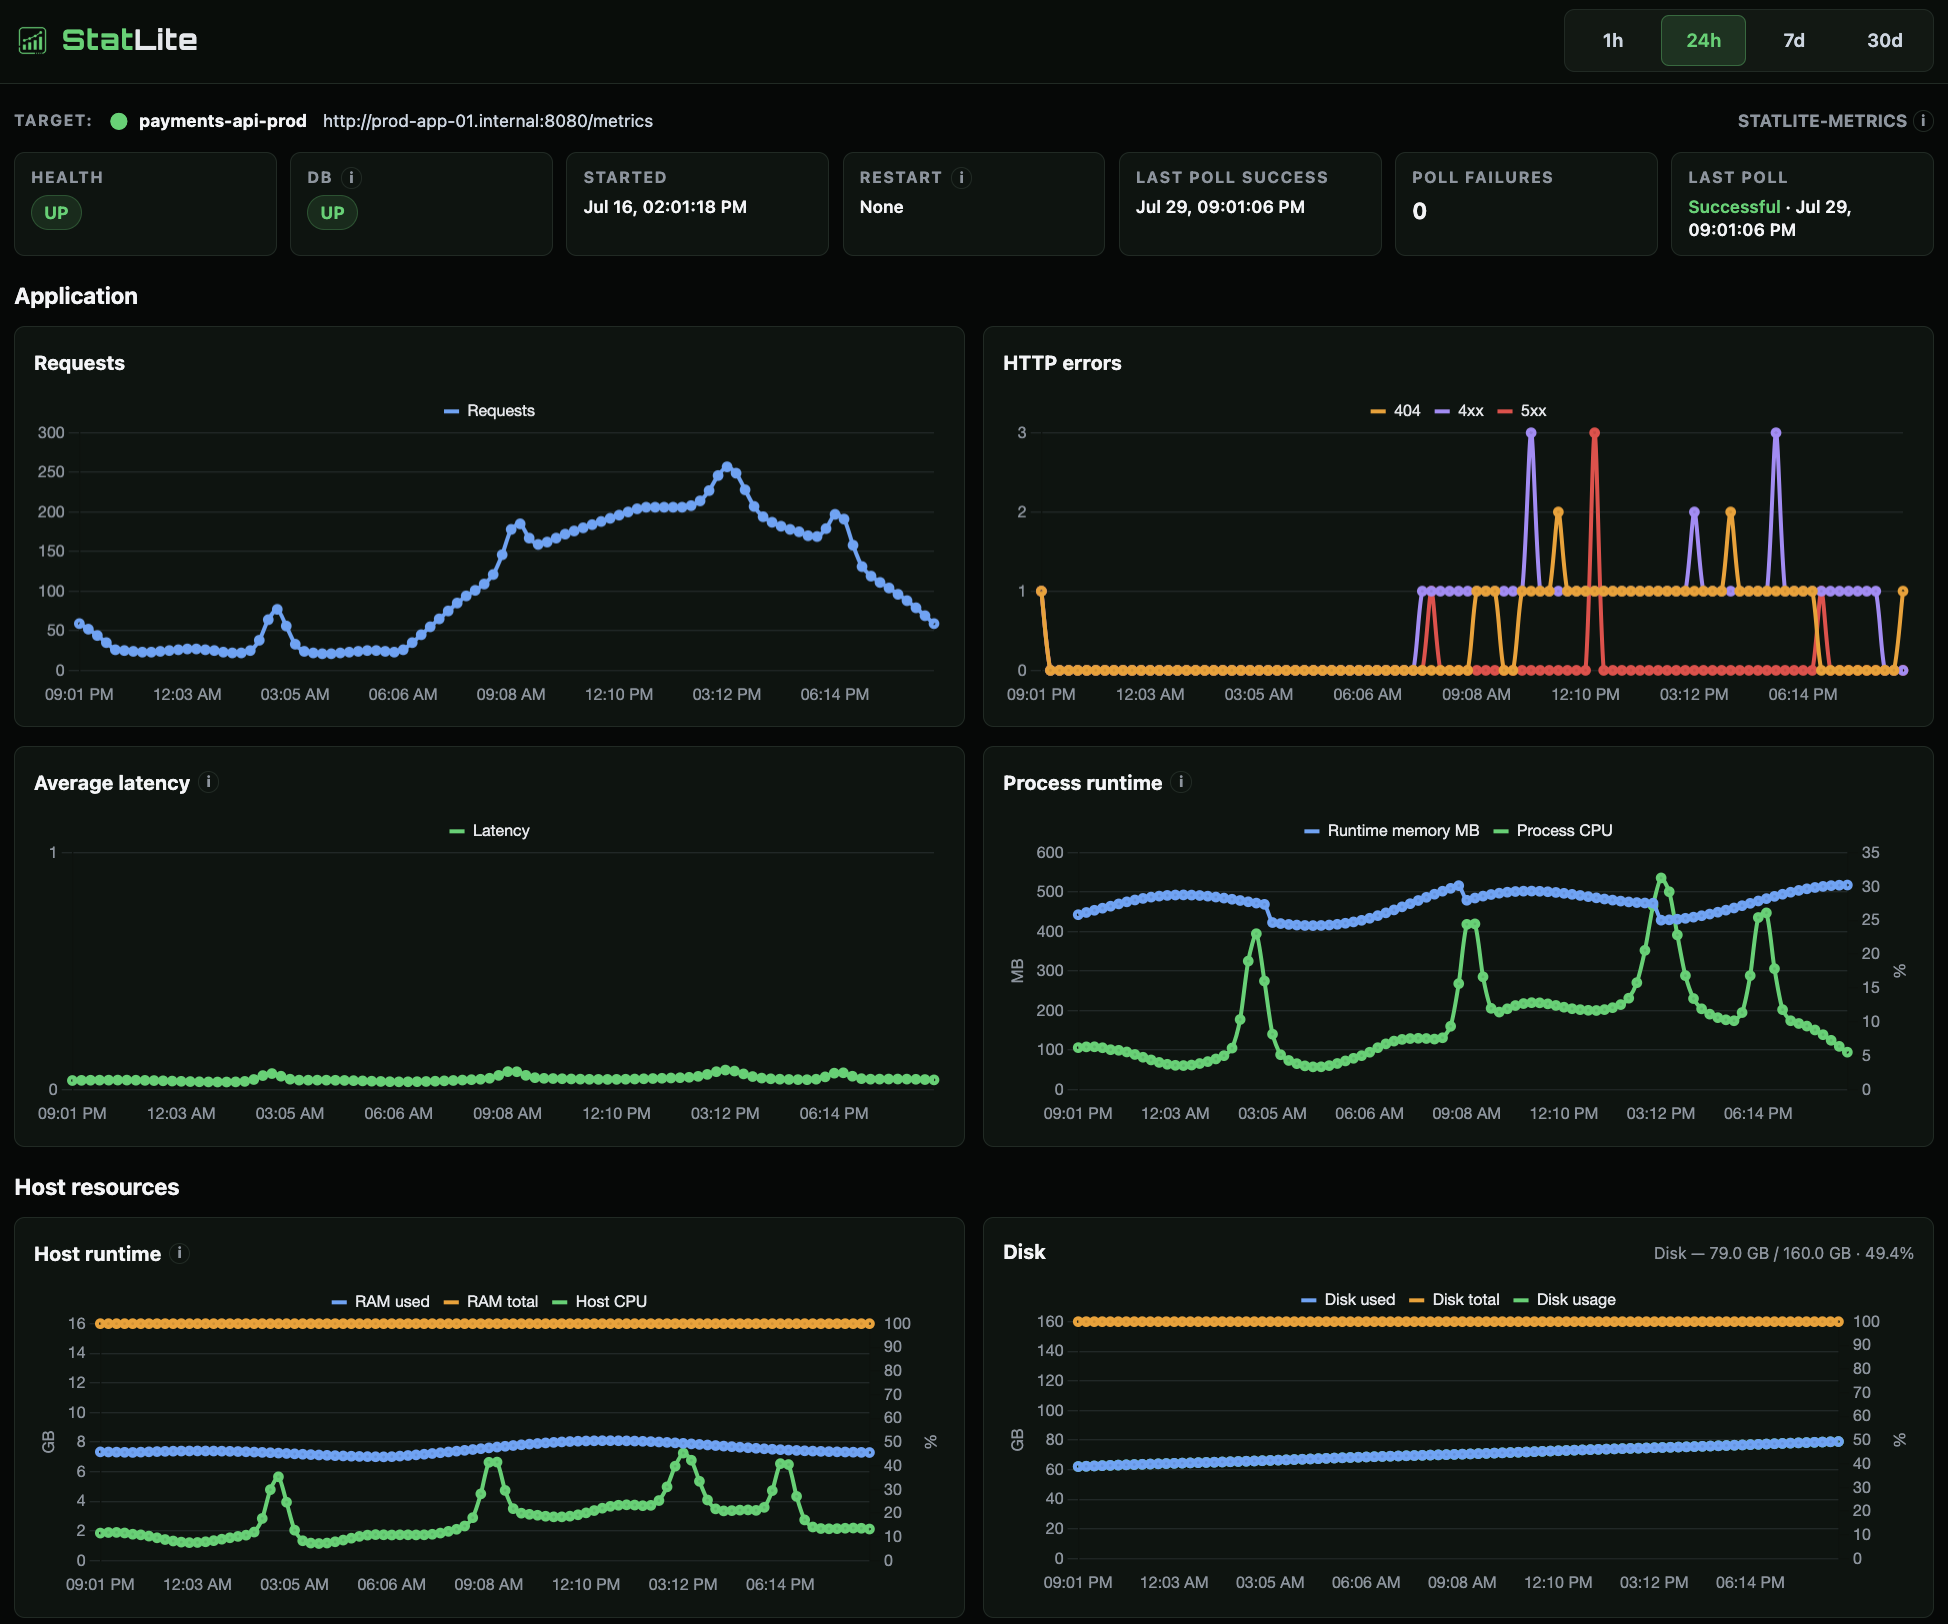
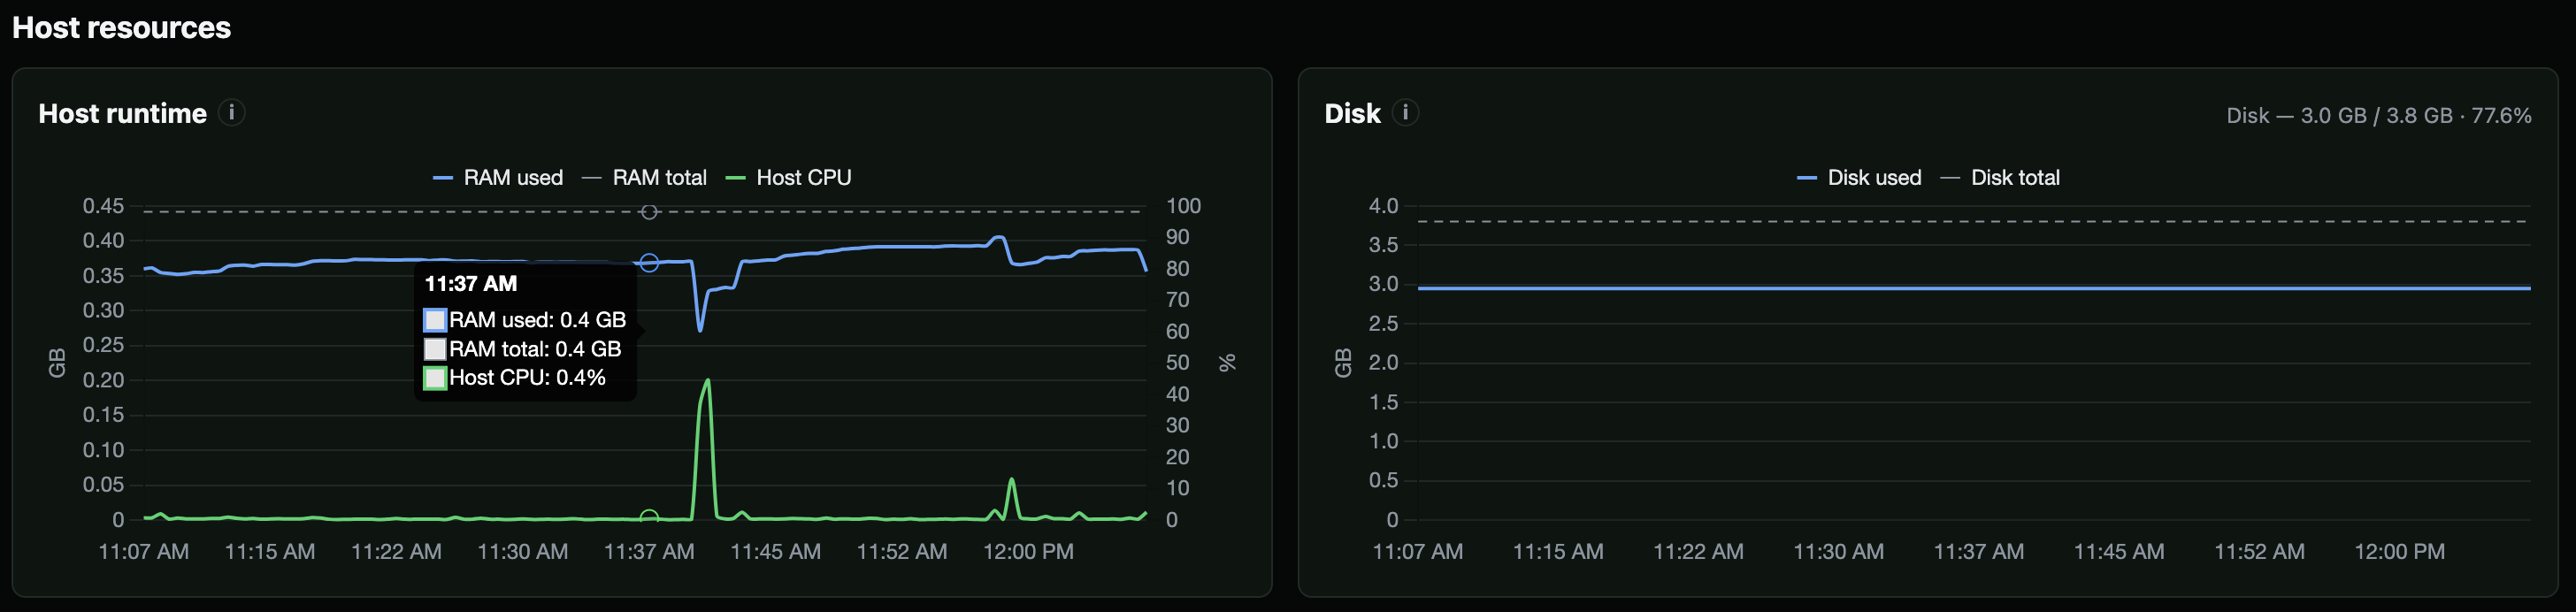
StatLite is a lightweight monitoring tool for small servers and VPS deployments. It collects metrics from Spring Boot (via Actuator), Quarkus, Micronaut, and any application implementing the StatLite Metrics v1 JSON endpoint, storing them in a local SQLite database. The built-in web UI shows health status, request rates, response times, CPU usage, memory consumption, and restart history with charts. StatLite runs as a single Go binary (~15 MiB idle) with no external dependencies like Prometheus or Grafana. You can install it via a curl script, Homebrew, Docker, or systemd service. Configuration uses a simple YAML file for the listen address, SQLite path, polling interval, and targets. The tool lacks built-in authentication and is meant for private or protected networks. Default retention is 90 days. An external read-only API is available for automation.
Should you self-host StatLite?
StatLite scores 47/100 on selfhost.directory (how scoring works) and ranks #7 of 9 in Application Performance Monitoring. It has 189 GitHub stars.
It shipped 9 stable releases in the past year. The latest, v0.7.0, came out on 24 October 2026. New versions land roughly every 6 days.
Setup is easy: most people get it running in one sitting. An official Docker image is available. It is MIT-licensed and written mostly in Go.
Its closest alternative on selfhost.directory is netdata (87/100, 81 201 stars). It scores higher overall, so compare the two before you pick. See StatLite vs netdata side by side.
Features
- Basic Auth for target endpoints
- Built-in dashboard with historical charts
- Config discovery via inspect command
- External read-only API
- Health check endpoint
- Micronaut Micrometer integration
- Multiple installation methods
- Quarkus Micrometer integration
- Remote host metrics for Spring Boot
- Resource-constrained deployment focus
- Self-hosted monitoring
- Self-monitoring (host metrics)
- Spring Boot Actuator integration
- SQLite-backed local storage
- StatLite Metrics v1 integration
StatLite README
More in Application Performance Monitoring
 uptraceSelf-hosted open-source APM unifying OpenTelemetry traces, metrics, logs in one platform. Replaces Datadog/New Relic at lower cost with ClickHouse for billions of spans.
 ZabbixZabbix is a self-hosted, open-source observability platform for monitoring networks, servers, VMs, and cloud infrastructure with distributed monitoring.
 Apache SkyWalkingOpen-source, self-hosted APM platform for cloud-native systems: tracing, metrics, logs, profiling and alerting on pluggable storage such as BanyanDB.
 corootSelf-hosted, open-source APM and observability platform where eBPF agents capture every telemetry signal without code changes, with service maps and SLO alerting.
 Durable ActorsSelf-hosted runtime for stateful serverless actors with durable persistence and serialized execution, replacing Cloudflare Durable Objects.
 hypertraceSelf-hosted distributed tracing platform that ingests OpenTelemetry, Jaeger, and Zipkin data with service graphs, dashboards, and real-time metrics aggregation.
 LinnixLinnix is a self-hosted eBPF agent that attributes stalls to specific processes and pods, finding noisy neighbors without SaaS.
 LunalyticsA self-hosted, open-source monitor for sites, servers, and containers that handles multiple users, public status pages, and over a hundred alert channels.
 MapleMaple is a self-hosted observability platform on OpenTelemetry and ClickHouse unifying traces, logs, metrics, session replay with an MCP server for AI agents.
 measureAn open-source crash reporting and mobile performance monitoring platform with session replays, self-hosted via Docker Compose on a Linux VM.
 n8nTraceObservability platform for n8n with execution analytics, Prometheus metrics, RBAC, and audit logging. Deployed as a hardened Docker container with PostgreSQL.
 netdataNetdata is an open-source, self-hosted infrastructure monitoring platform with per-second metrics, automated dashboards, ML anomaly detection, and zero-config deployment.
0 comments