
Self-host Kibana
v8.19.25Elasticsearch dashboard for data visualization
- Stars
- 21 378
- RAM
- 4GB minimum for Docker Desktop
- Requires
- Elasticsearch
docker.elastic.co/kibana/kibana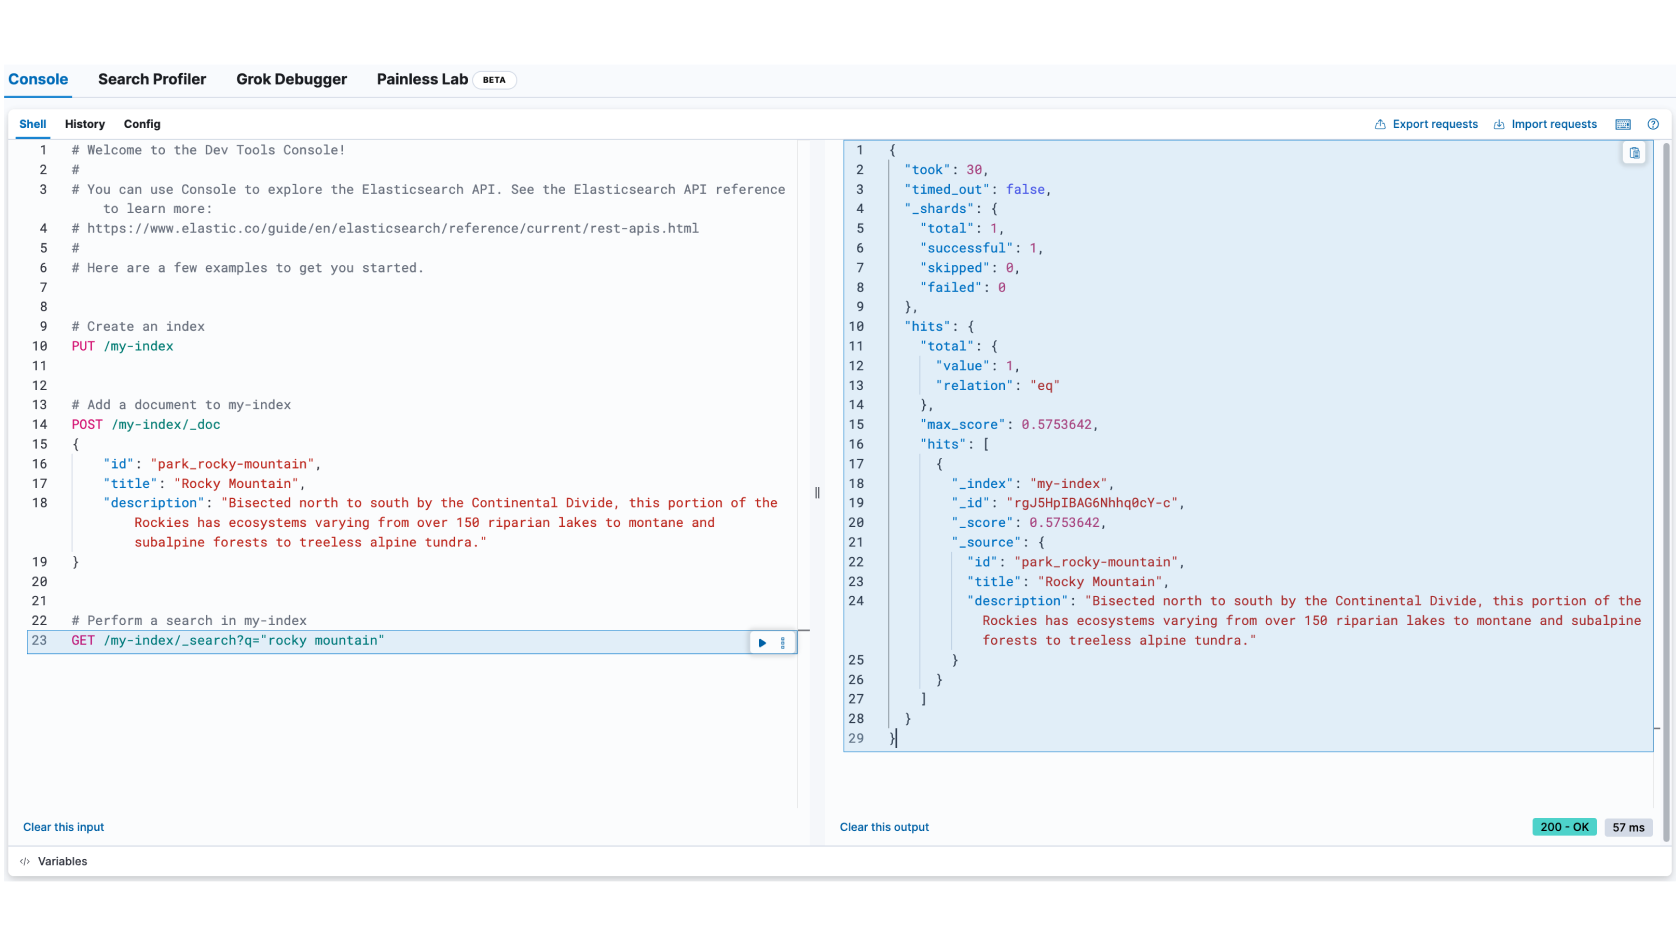
What is Kibana?
The web interface for querying, analyzing, and visualizing Elasticsearch data. Supports dashboards, visualizations, alerting, machine learning anomaly detection, geospatial analysis, security SIEM, observability monitoring, and enterprise search experiences. Runs on Linux, macOS, Windows as downloadable packages or Docker containers alongside an Elasticsearch instance.
Kibana alternatives
 elasticsearchOpen-source distributed search engine that handles structured, unstructured, and vector data for real-time search, observability, and AI workloads.Compareelasticsearch with Kibana
 grafanaGrafana is a self-hosted, open-source observability platform for querying, visualizing, and alerting on telemetry data from many sources.Comparegrafana with Kibana
 monoscopeOpen-source, self-hosted observability that keeps logs, metrics and traces in your own S3 buckets, with plain-English queries, scheduled AI agents and session replay.Comparemonoscope with Kibana
 netdataNetdata is an open-source, self-hosted infrastructure monitoring platform with per-second metrics, automated dashboards, ML anomaly detection, and zero-config deployment.Comparenetdata with Kibana
 corootSelf-hosted, open-source APM and observability platform where eBPF agents capture every telemetry signal without code changes, with service maps and SLO alerting.Comparecoroot with Kibana
 logstashAn open-source server-side data pipeline that ingests, transforms and routes events with 200+ plugins; self-hosted via Docker, deb/rpm packages or tar/zip downloads.Comparelogstash with Kibana
 gigapipeSelf-hosted open-source observability backend merging four telemetry types into ClickHouse with Loki, Prometheus, Tempo and Pyroscope protocol support.Comparegigapipe with Kibana
 MapleMaple is a self-hosted observability platform on OpenTelemetry and ClickHouse unifying traces, logs, metrics, session replay with an MCP server for AI agents.CompareMaple with Kibana
Should you self-host Kibana?
Kibana scores 63/100 on selfhost.directory (how scoring works) and ranks #2 of 4 in Dashboards. It has 21 378 GitHub stars, +68 in the last 30 days.
It shipped 27 stable releases in the past year. The latest, v8.19.25, came out on 10 November 2026. New versions land roughly every 1 days.
Setup is easy: most people get it running in one sitting. An official Docker image is available. It is Other-licensed and written mostly in Typescript.
Its closest alternative on selfhost.directory is Heimdall Application Dashboard (73/100, 9 414 stars). It scores higher overall, so compare the two before you pick. See Kibana vs Heimdall Application Dashboard side by side.
Features
- Alerts and workflows
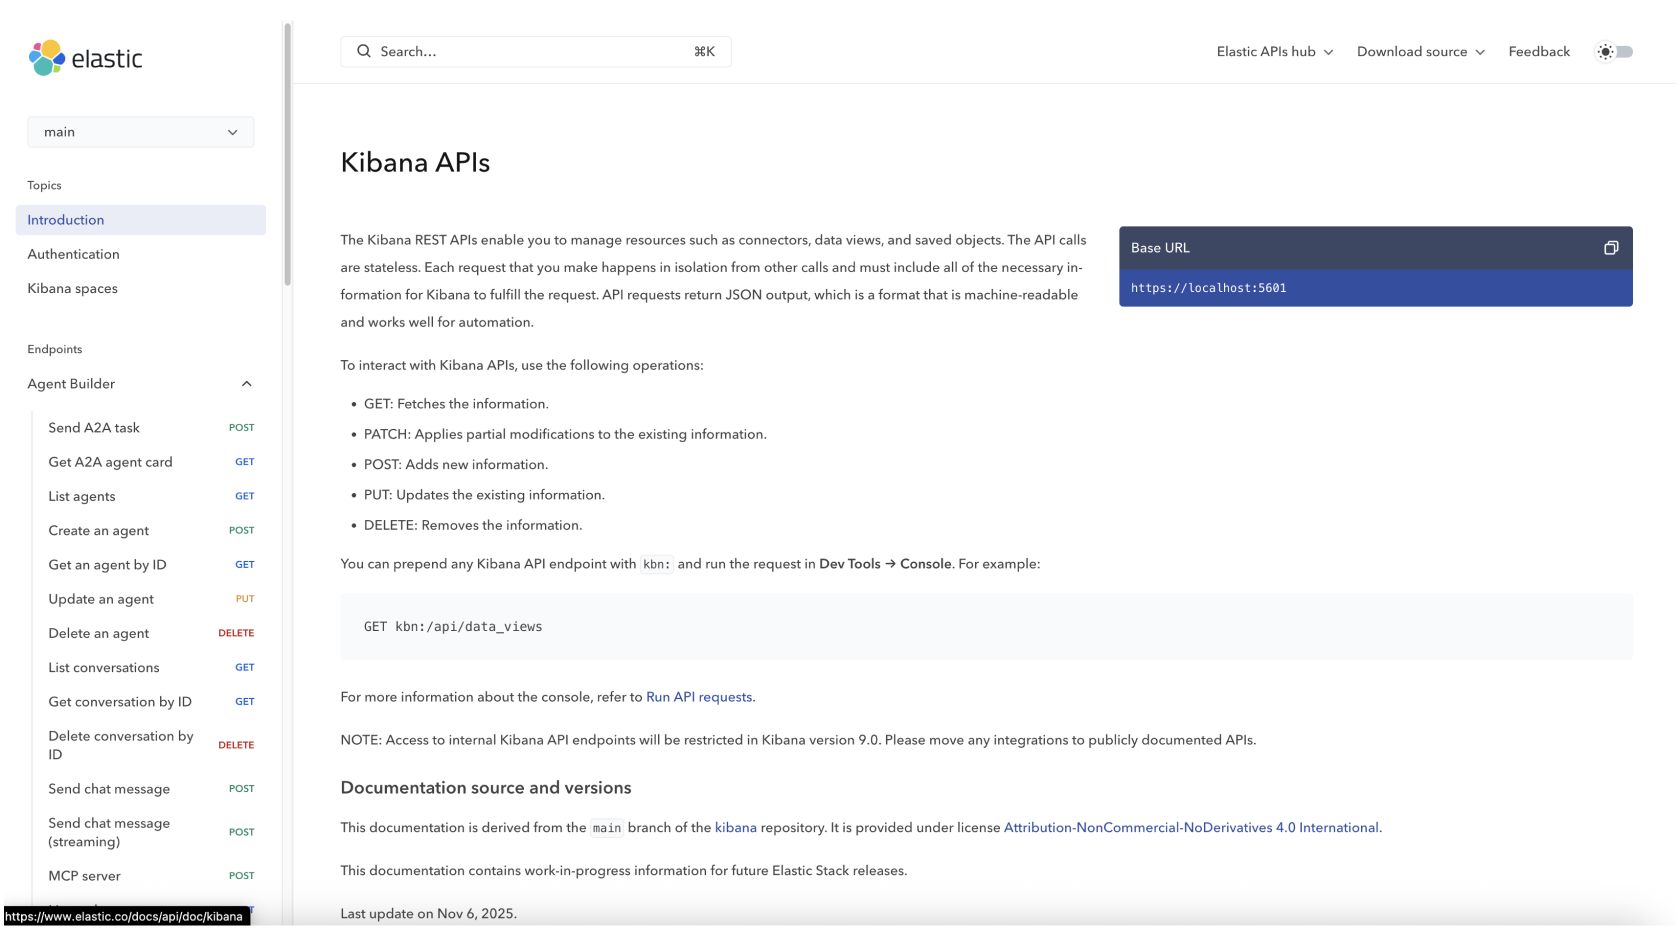
- API and Terraform
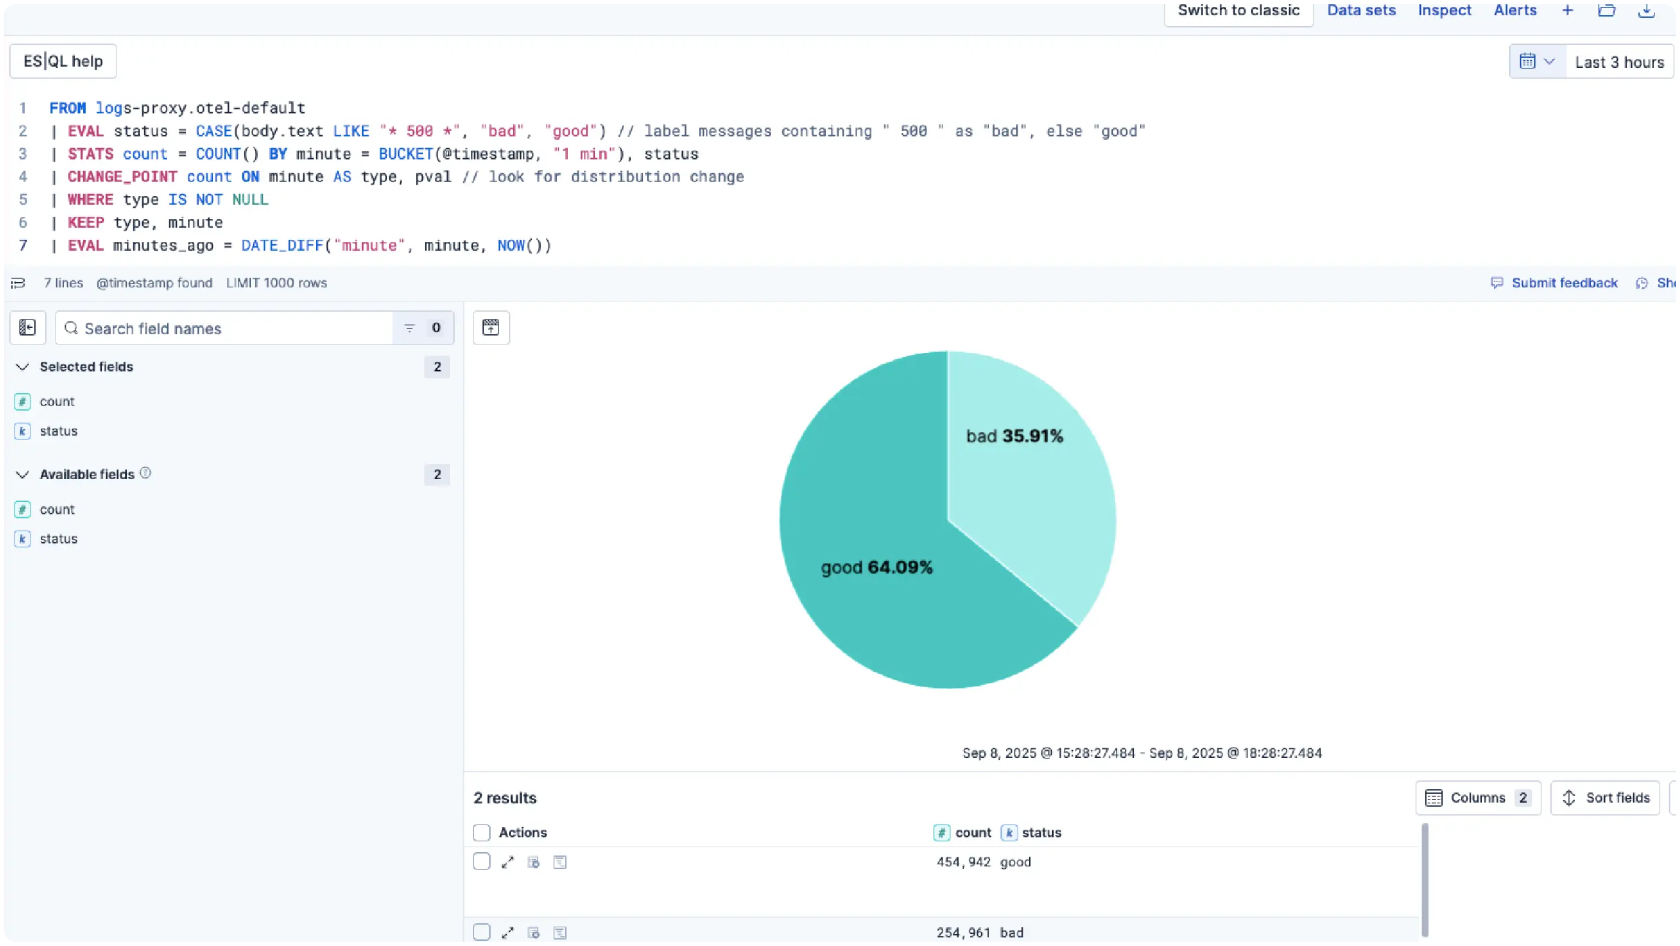
- Dashboards and visualizations
- ES|QL console
- Geospatial analysis
- Machine Learning
Kibana README
Kibana is the open source interface to query, analyze, visualize, and manage your data stored in Elasticsearch.
More in Dashboard
 linux-dashSelf-hosted, open-source web dashboard for watching a Linux server's system status, network, accounts and apps, with drop-in Node.js, Go, Python or PHP back ends.
 MetabaseSelf-hosted, open-source BI tool with dashboards, a no-code query builder, a SQL editor, Metabot AI answers and embedding; run it in Docker or as a Java JAR.
 muninOpen-source, self-hosted infrastructure monitor: a master polls nodes every five minutes, stores data in RRD files, and draws graphs in a web UI with 500+ plugins.
 openclaw-dashboardA self-hosted, open-source dashboard that tracks OpenClaw AI agent spending, token usage, cron jobs, sessions and gateway health in one zero-dependency Go binary.
 ParseableParseable is a self-hosted, open-source observability platform in Rust on a Parquet data lake: logs, metrics and traces with alerting, dashboards, PromQL and SQL.
 PgHeroSelf-hosted, open-source performance dashboard for Postgres: slow queries, index suggestions, connection and space stats, shipped as a Docker image or Rails engine.
 RedashOpen-source, self-hosted business intelligence tool: query over 35 database and API back ends, build dashboards, schedule refreshes, and get data alerts.
 SupersetApache Superset is a Data Visualization and Data Exploration Platform
 TeslaMateOpen-source, self-hosted logger that records your Tesla's drives, charges and battery data to Postgres and adds bundled Grafana dashboards plus MQTT output.
 Typesense-DashboardA Typesense Dashboard to manage and browse collections.
 Wall Panel🖼️ Wall panel mode and photo screensaver for your Home Assistant Dashboards
 wrapperrSelf-hosted, open-source web app that turns Plex viewing history into an interactive Wrapped-style recap via the Tautulli API, with Plex login and admin config.
0 comments