
Self-host victoriametrics
v1.156.0Prometheus-compatible TSDB for metrics and alerting
- Stars
- 18 113
- Port
- 8428 (HTTP server for querying, ingestion, vmui and metrics endpoints)
victoriametrics/victoria-metrics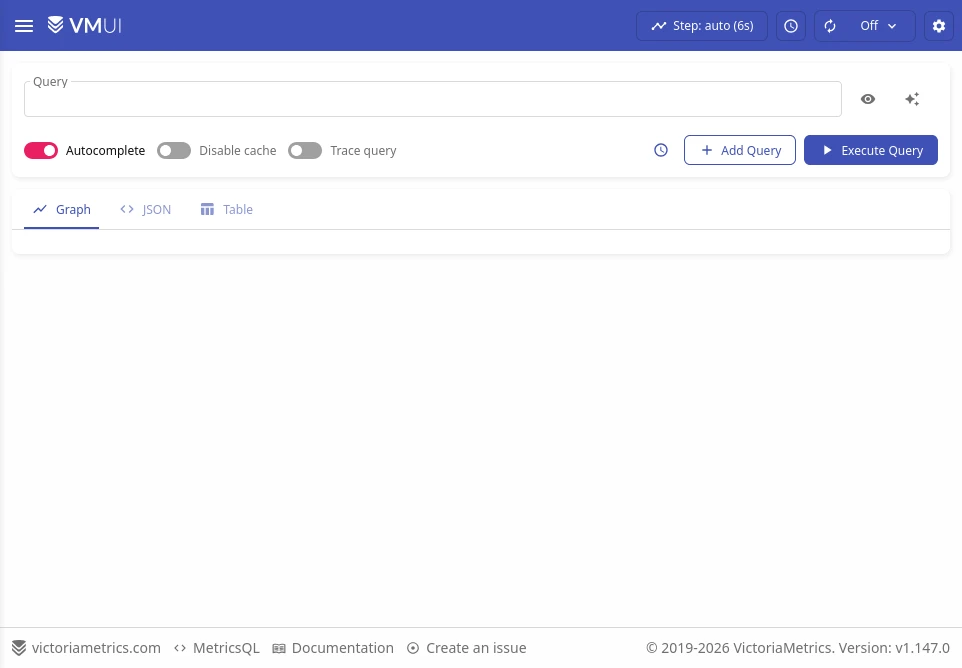
What is victoriametrics?
VictoriaMetrics keeps metrics in its own storage engine and answers through Prometheus-compatible APIs, so teams can leave Grafana dashboards and Prometheus-style rules largely untouched while moving the storage layer away from Prometheus or Graphite. Operationally it is deliberately plain: one self-contained executable that needs nothing else installed, configuration by command-line flags with tuned defaults, everything written into the folder named by -storageDataPath, and 31 days of history kept unless -retentionPeriod says otherwise. Getting data in is flexible, covering scraping of Prometheus exporters, self-scraping, remote write, InfluxDB line protocol, Graphite plaintext, OpenTSDB, DataDog, New Relic, OpenTelemetry, JSON lines, CSV and a native binary format. Queries run in MetricsQL, which is PromQL-compatible, and the bundled vmui screens cover ad-hoc graphs, metric browsing, cardinality analysis, top and active queries and query tracing; cost control comes from stream aggregation (usable instead of StatsD), relabeling and a series limiter. Point-in-time snapshots feed the vmbackup and vmrestore tools, the storage survives abrupt shutdowns, and NFS mounts such as Amazon EFS work as backing storage. You can deploy it by downloading a release, starting the container image (also mirrored at Quay), using the official Helm charts, the Kubernetes operator, Ansible roles or a compose stack that adds vmagent and Grafana; a separately documented cluster build scales horizontally. Downsampling, per-dataset retentions, automated backups and anomaly detection sit in the paid Enterprise build, and a hosted Cloud offering exists as well.
victoriametrics alternatives
 pyroscopeOpen-source, self-hosted continuous profiling platform: ingest CPU/memory profiles via SDKs, Alloy or eBPF, store in object storage and query flame graphs in Grafana.Comparepyroscope with victoriametrics
 gtsdbGTSDB is a self-hosted, open-source time-series database in Go using WAL-first architecture for sub-millisecond reads and 233x faster writes than InfluxDB.Comparegtsdb with victoriametrics
 prometheusPrometheus is a self-hosted, open-source monitoring toolkit that pulls metrics via HTTP, stores them locally, and uses PromQL for powerful queries and alerting.Compareprometheus with victoriametrics
 grafanaGrafana is a self-hosted, open-source observability platform for querying, visualizing, and alerting on telemetry data from many sources.Comparegrafana with victoriametrics
 nanotdbNanoTDB is a self-hosted, open-source TSDB that runs as a single binary with built-in dashboard, editor, Explore view, and offline CLI for Raspberry Pi and edge devices.Comparenanotdb with victoriametrics
 Percona Monitoring and Management (PMM)Self-hosted open-source database observability platform with query analytics, dashboards, advisors, alerting, and backup for major databases.ComparePercona Monitoring and Management (PMM) with victoriametrics
 memgraphSelf-hosted, open-source in-memory graph database with Cypher, vector indexes and the MAGE algorithm library for GraphRAG and real-time graph analytics.Comparememgraph with victoriametrics
 tdengineSelf-hosted open-source time-series database for IoT and industrial data, offering clustering, stream processing, subscriptions, TDgpt AI and Grafana or Kafka links.Comparetdengine with victoriametrics
All self-hosted alternatives to Graphite → All self-hosted alternatives to Thanos → All self-hosted alternatives to InfluxDB →
Should you self-host victoriametrics?
victoriametrics scores 78/100 on selfhost.directory (how scoring works) and ranks #3 of 5 in Time Series. It has 18 113 GitHub stars, +266 in the last 30 days.
It shipped 26 stable releases in the past year. The latest, v1.156.0, came out on 9 November 2026. New versions land roughly every 7 days.
Setup is moderate: expect some configuration beyond a single command. An official Docker image is available. It is Apache-2.0-licensed and written mostly in Go.
Its closest alternative on selfhost.directory is TimescaleDB (77/100, 23 861 stars). victoriametrics scores higher overall. See victoriametrics vs TimescaleDB side by side.
Features
- Alerting via vmalertvmalert is a separate component of the VictoriaMetrics ecosystem.
- Built-in web UI (vmui)
- Cardinality limiter
- Deduplication of scraped samples
- Global query view
- Instant snapshots and backup/restore
- MetricsQL query language
- Metrics relabeling
- Multi-protocol metrics ingestion
- No external dependencies / single binary
- Prometheus-compatible storage and querying API
- Prometheus exporter scraping
- Retention with automatic data deletion
- Stream Aggregation
victoriametrics README


VictoriaMetrics is a fast, cost-effective, and scalable solution for monitoring and managing time series data. It delivers high performance and reliability, making it an ideal choice for businesses of all sizes.
Here are some resources and information about VictoriaMetrics:
- Case studies: Grammarly, Roblox, Wix, Spotify,....
- Available: Binary releases, Docker images on Docker Hub and Quay, Source code.
- Deployment types: Single-node version and Cluster version under Apache License 2.0.
- Getting started: Read key concepts and follow the quick start guide.
- Community: Slack (join via Slack Inviter), X (Twitter), YouTube. See full list here.
- Changelog: Project evolves fast - check the CHANGELOG, and How to upgrade.
- Enterprise support: Contact us for commercial support with additional enterprise features.
- Enterprise releases: Enterprise and long-term support releases (LTS) are publicly available and can be evaluated for free using a free trial license.
- Security: we achieved security certifications for Database Software Development and Software-Based Monitoring Services.
FAQ
How does VictoriaMetrics handle backfilling of old (historical) metrics?
There is no limitation on backfilling historical or out-of-order samples as long as they fall inside the configured retention period.
Is it safe to enable remote write in Prometheus?
Yes, Prometheus keeps writing to its local storage after remote write is enabled; using vmagent for scraping is recommended.
What is the difference between vmagent and Prometheus?
vmagent usually needs less CPU, RAM and disk IO for very large target counts, keeps independent disk-backed buffers per remote storage and supports many ingestion protocols.
Can I use VictoriaMetrics instead of Prometheus?
Yes, in most cases: scraping/service discovery, alerting and recording rules via vmalert, and Prometheus-compatible querying in Grafana.
What are scalability limits of VictoriaMetrics?
The single-node version scales vertically and can handle about 100 million active time series and 2 million samples per second; the cluster version scales horizontally to billions of active time series.
Does VictoriaMetrics support replication?
Yes, the cluster version documents replication and data safety.
Does VictoriaMetrics support high availability?
Yes, high availability is documented for both single-node and cluster setups.
How to contribute to VictoriaMetrics?
See the Contributing guide in the documentation.
How to start using VictoriaMetrics?
Follow the Quick Start guide.
How does Victoriametrics work?
The FAQ lists technical articles explaining the internals of components such as vmagent, vmstorage, vminsert and vmselect.
Are there performance comparisons with other solutions?
Yes, the docs link to a collection of benchmark articles.
Which features does VictoriaMetrics have?
See the Prominent Features section of the single-node documentation for the full list.
Who uses VictoriaMetrics?
The FAQ points readers to the published case studies and articles.
What is the main purpose of VictoriaMetrics?
The project states its purpose is to be the best tool for monitoring and observability.
More in Time Series
 ArcadeDBOpen-source, self-hosted multi-model database: one ACID engine for graph, document, key-value, vector, full-text and time-series data, queried in SQL, Cypher or Gremlin.
 cratedbA self-hosted, open-source distributed SQL database with PostgreSQL wire protocol support, for real-time analytics over time-series, full-text and vector data.
 EmoncmsOpen-source app that ingests, logs and charts energy, temperature and environmental readings; self-hosted free via Docker or EmonScripts, from OpenEnergyMonitor.
 GrafanaMimirOpen-source, self-hosted long-term TSDB for Prometheus: multi-tenant, replicated metrics storage that scales past a billion active series.
 greptimedbSelf-hosted and open-source: one Rust columnar telemetry store keeps metrics, logs and traces in a single engine with SQL or PromQL queries over object storage.
 influxdbOpen-source, single-node time series database you self-host for real-time metrics and events, querying Parquet-backed data with SQL or InfluxQL.
 questdbSelf-hosted, open-source time-series database with SAMPLE BY and ASOF join SQL, QuestDB Wire Protocol ingestion, PGWire support and a web console.
 Super ProductivityFree, open-source, local-first to-do app with timeboxing, time tracking, planner and Kanban boards; self-host the web app via Docker or SuperSync.
- tdengineSelf-hosted open-source time-series database for IoT and industrial data, offering clustering, stream processing, subscriptions, TDgpt AI and Grafana or Kafka links.
 TelegrafOpen-source, self-hosted telemetry agent that collects, processes and writes metrics and logs via 300+ plugins, shipped as a single static binary configured in TOML.
 timescaleTimescaleDB is an open-source, self-hosted PostgreSQL extension for time-series and event data, with hypertables, columnar compression, and continuous aggregates.
0 comments