
Self-host TraceRoot
v1.3.3Open-source AI agent observability and improvement platform
- Stars
- 1 084
- Ports
- 3000 (Web UI (Next.js frontend)), 8000 (REST API (FastAPI backend)), 8100 (AI Agent Service)
- Requires
- ClickHouse, MinIO (S3-compatible), PostgreSQL, Redis
What is TraceRoot?
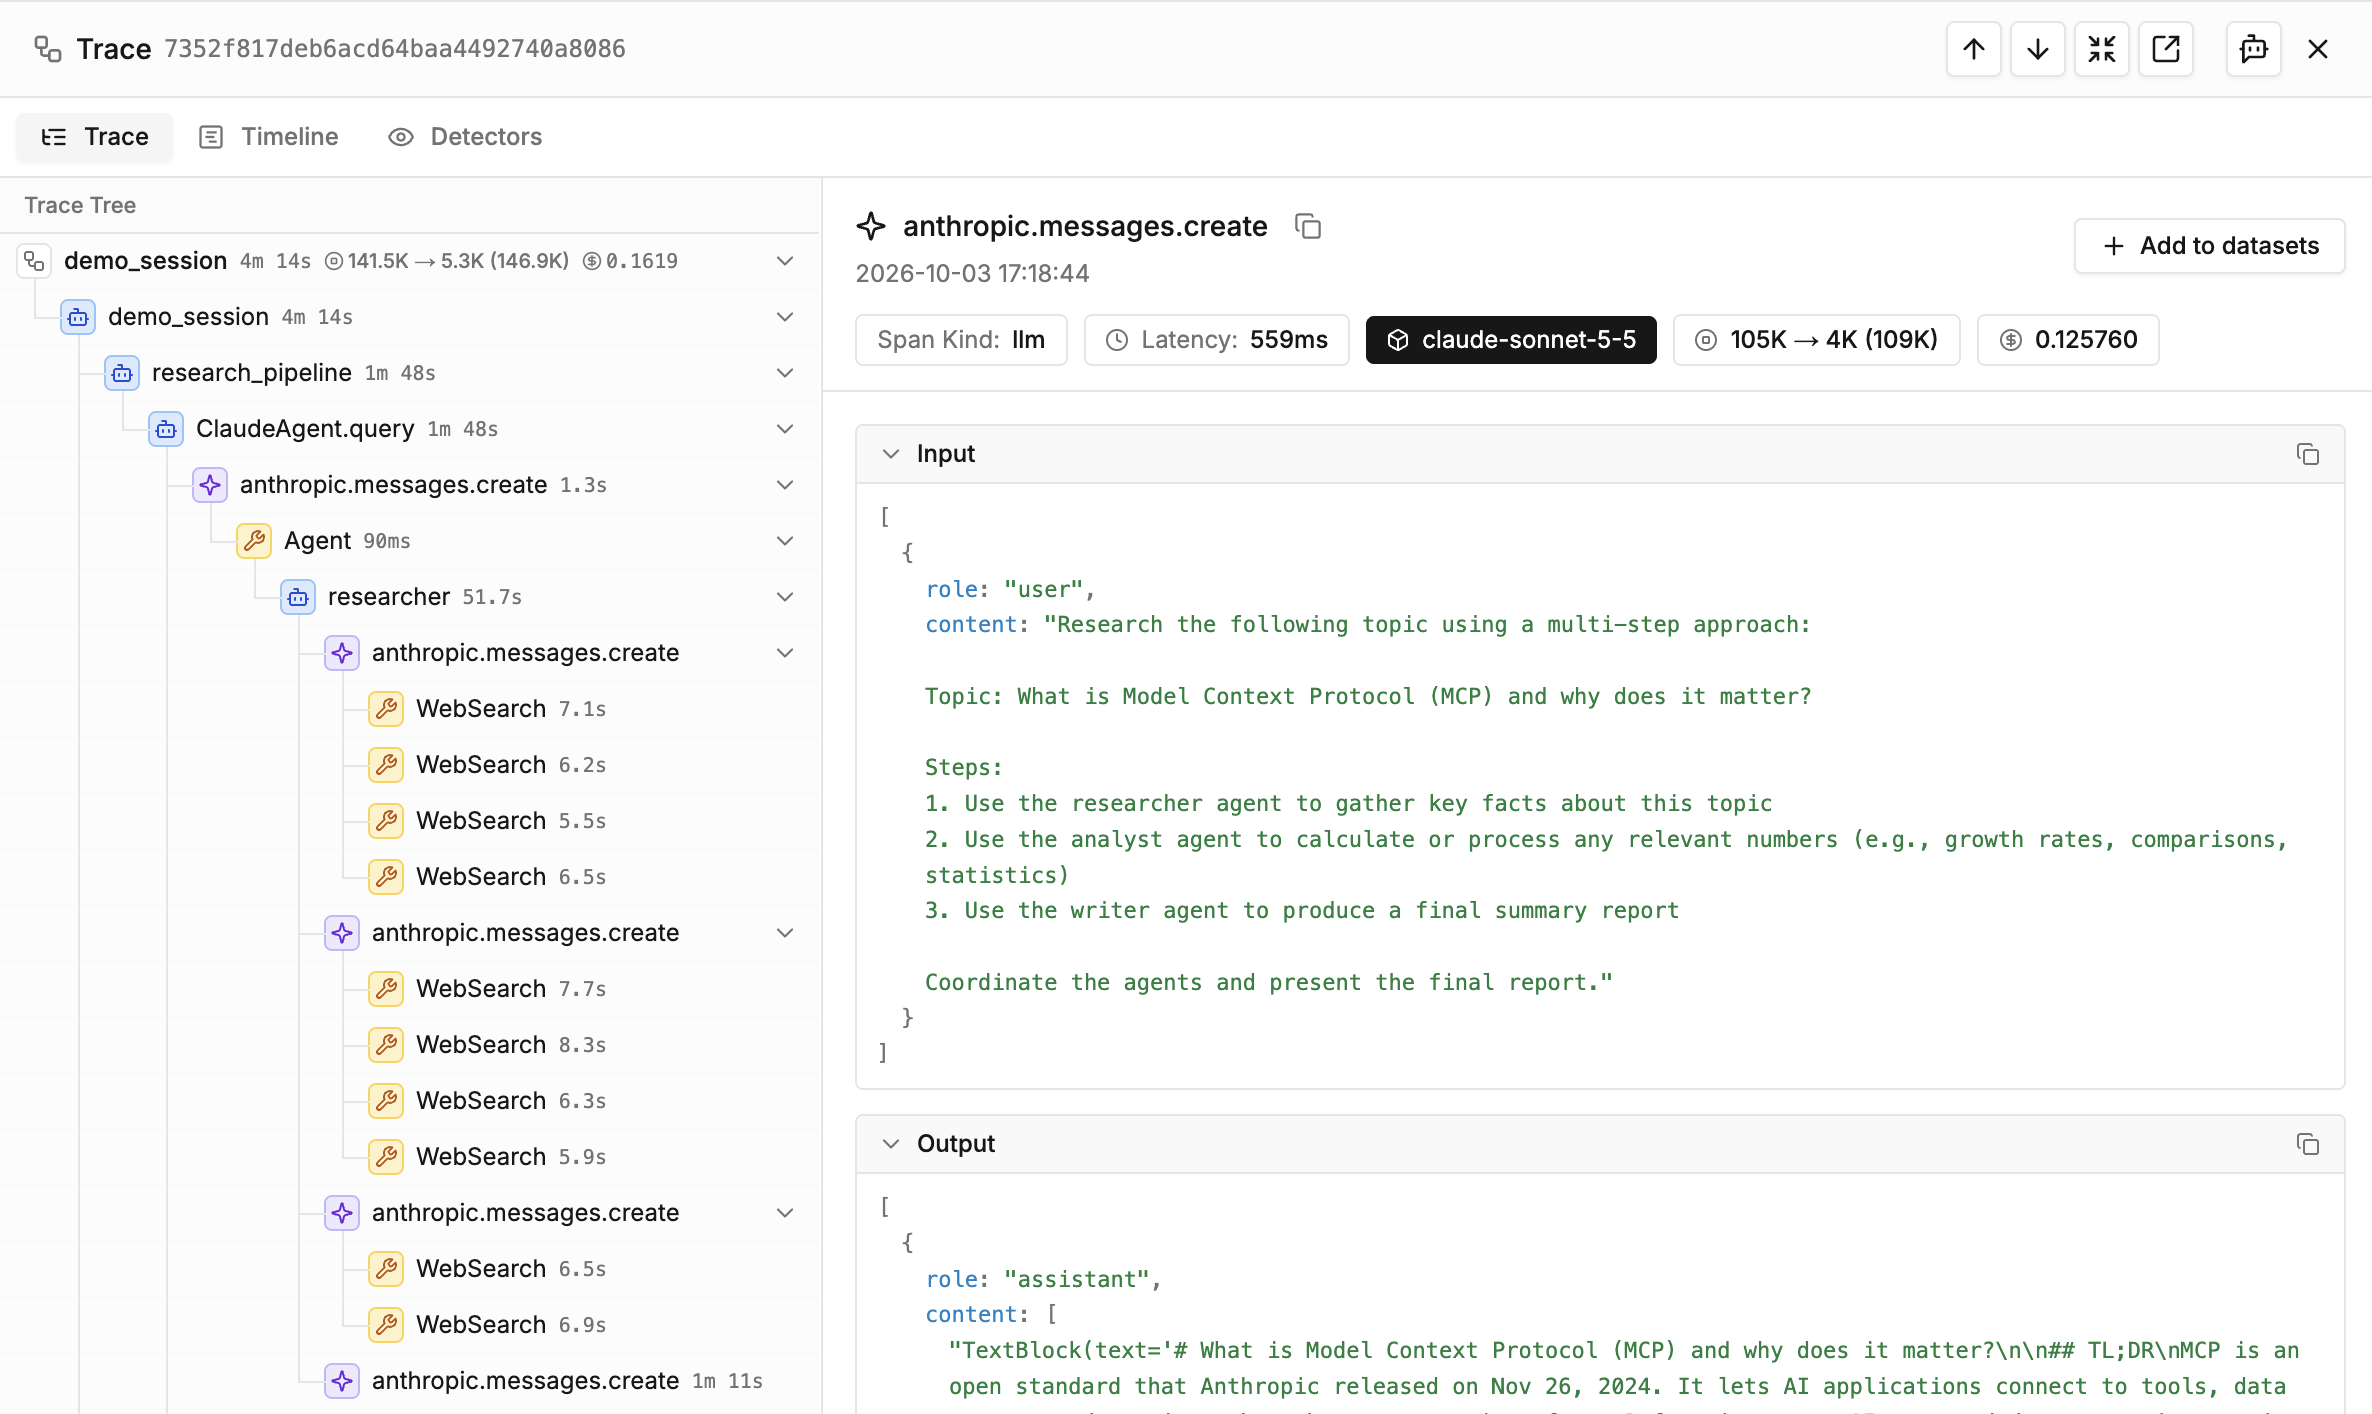
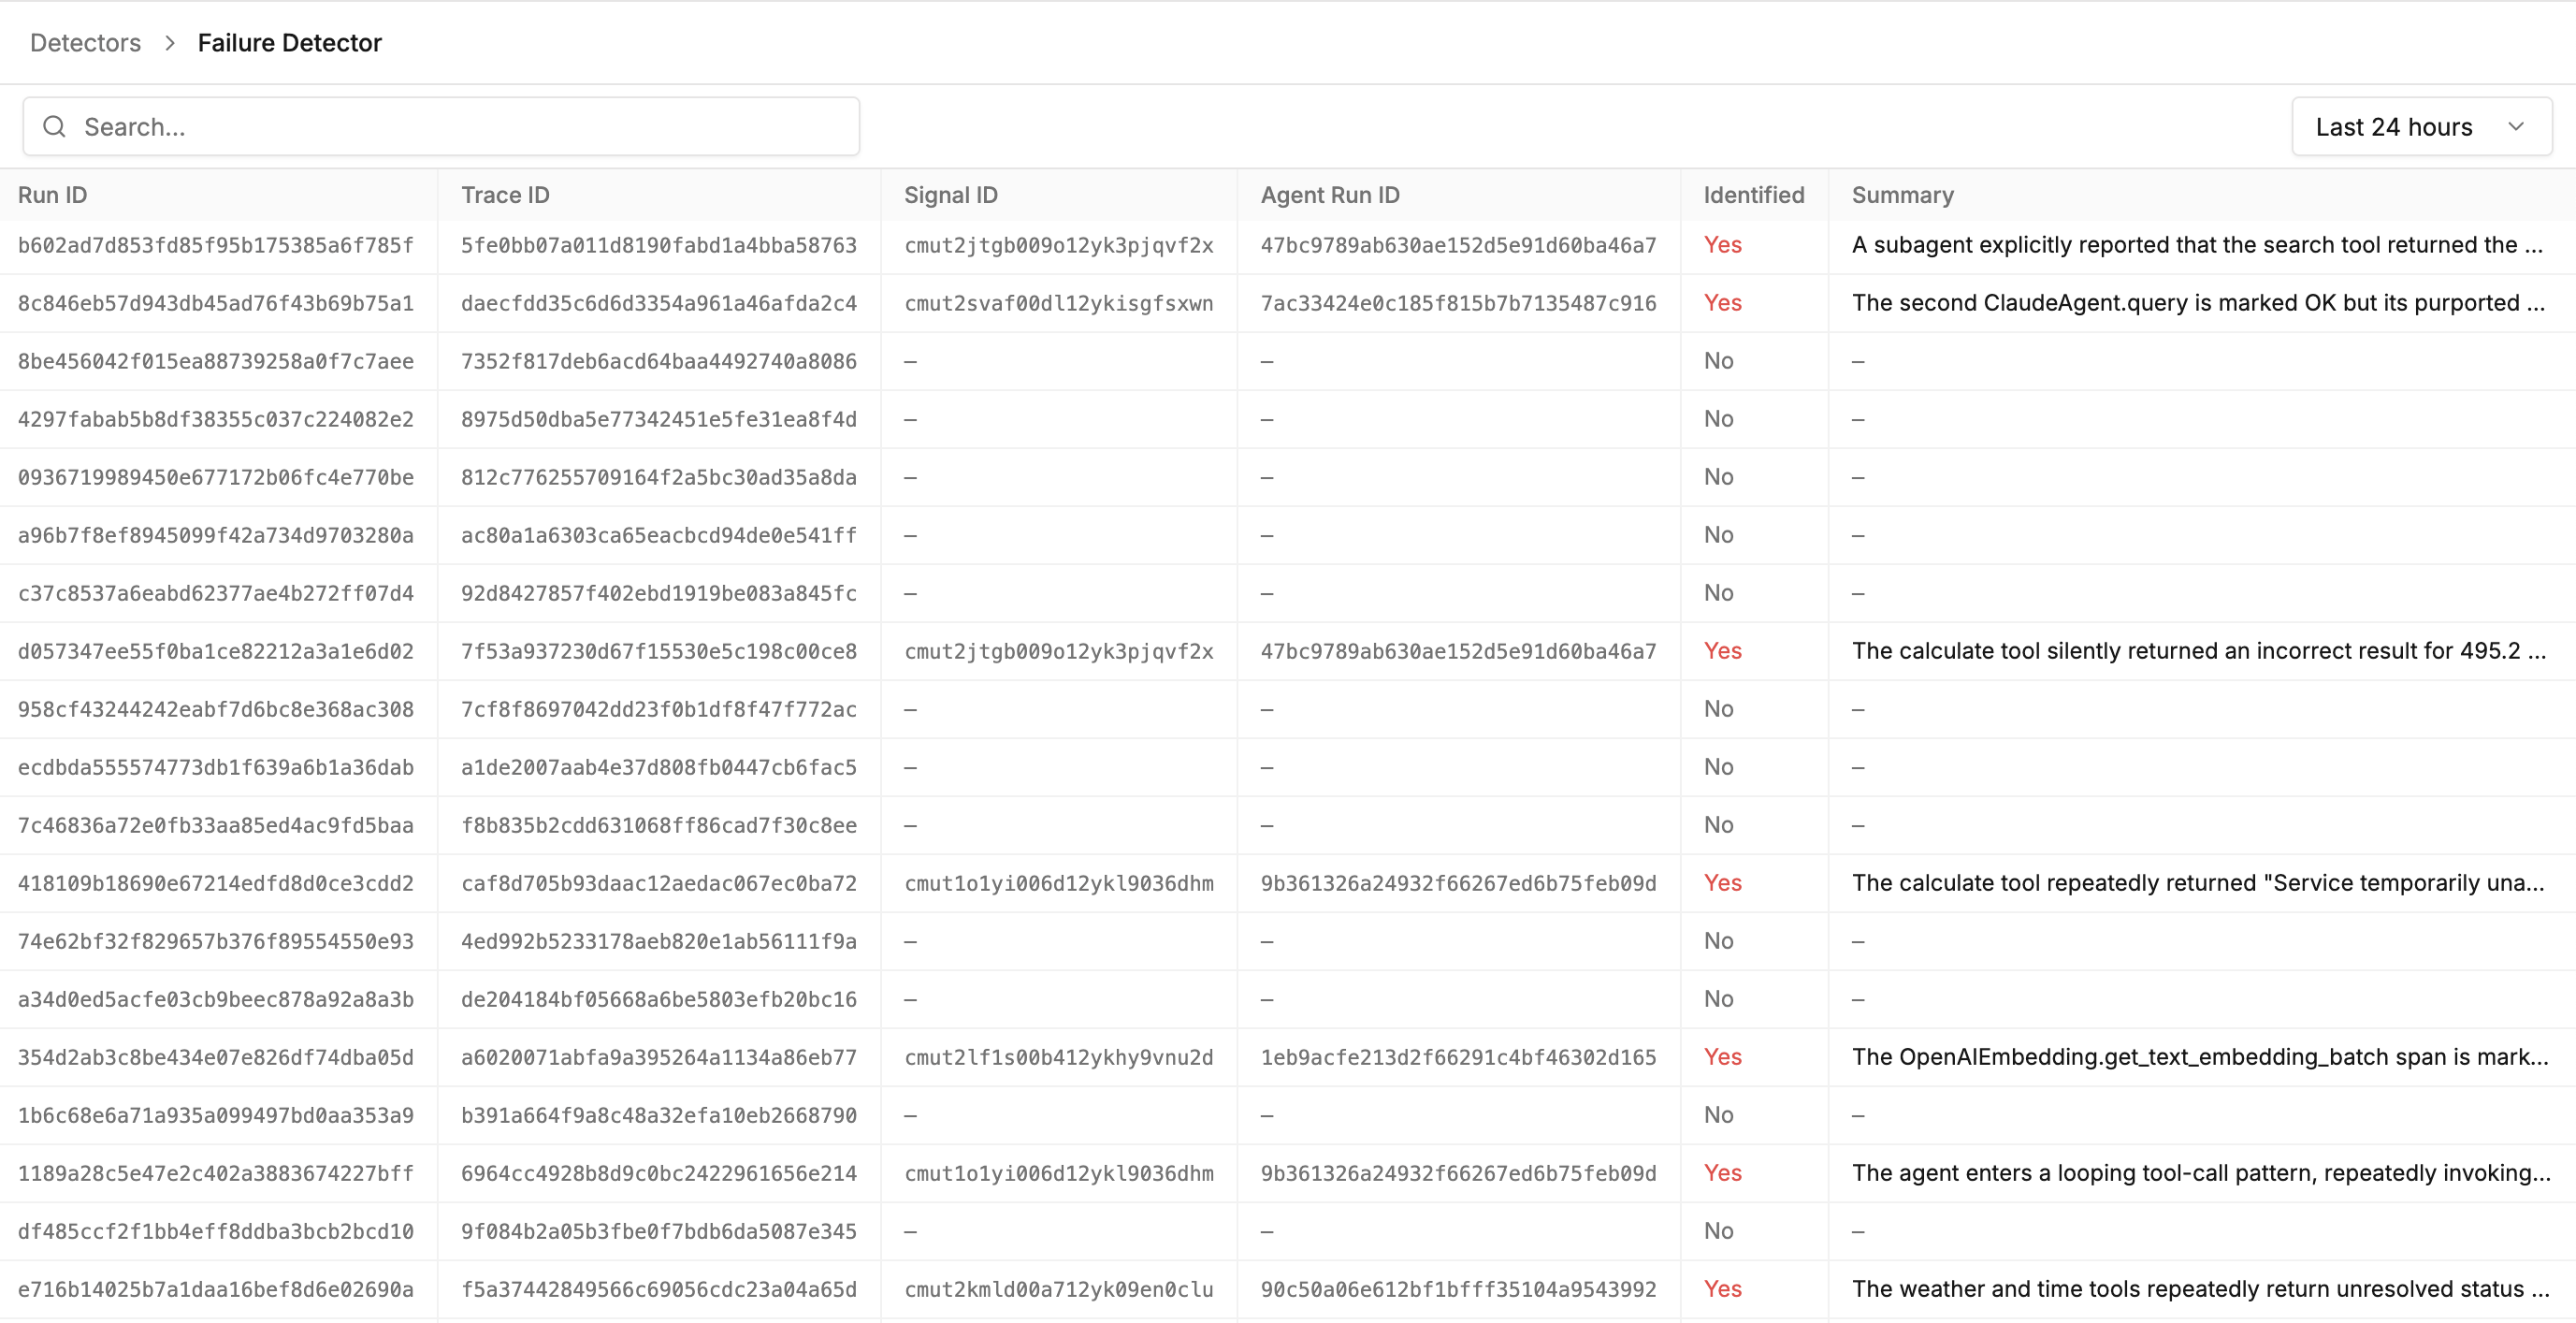
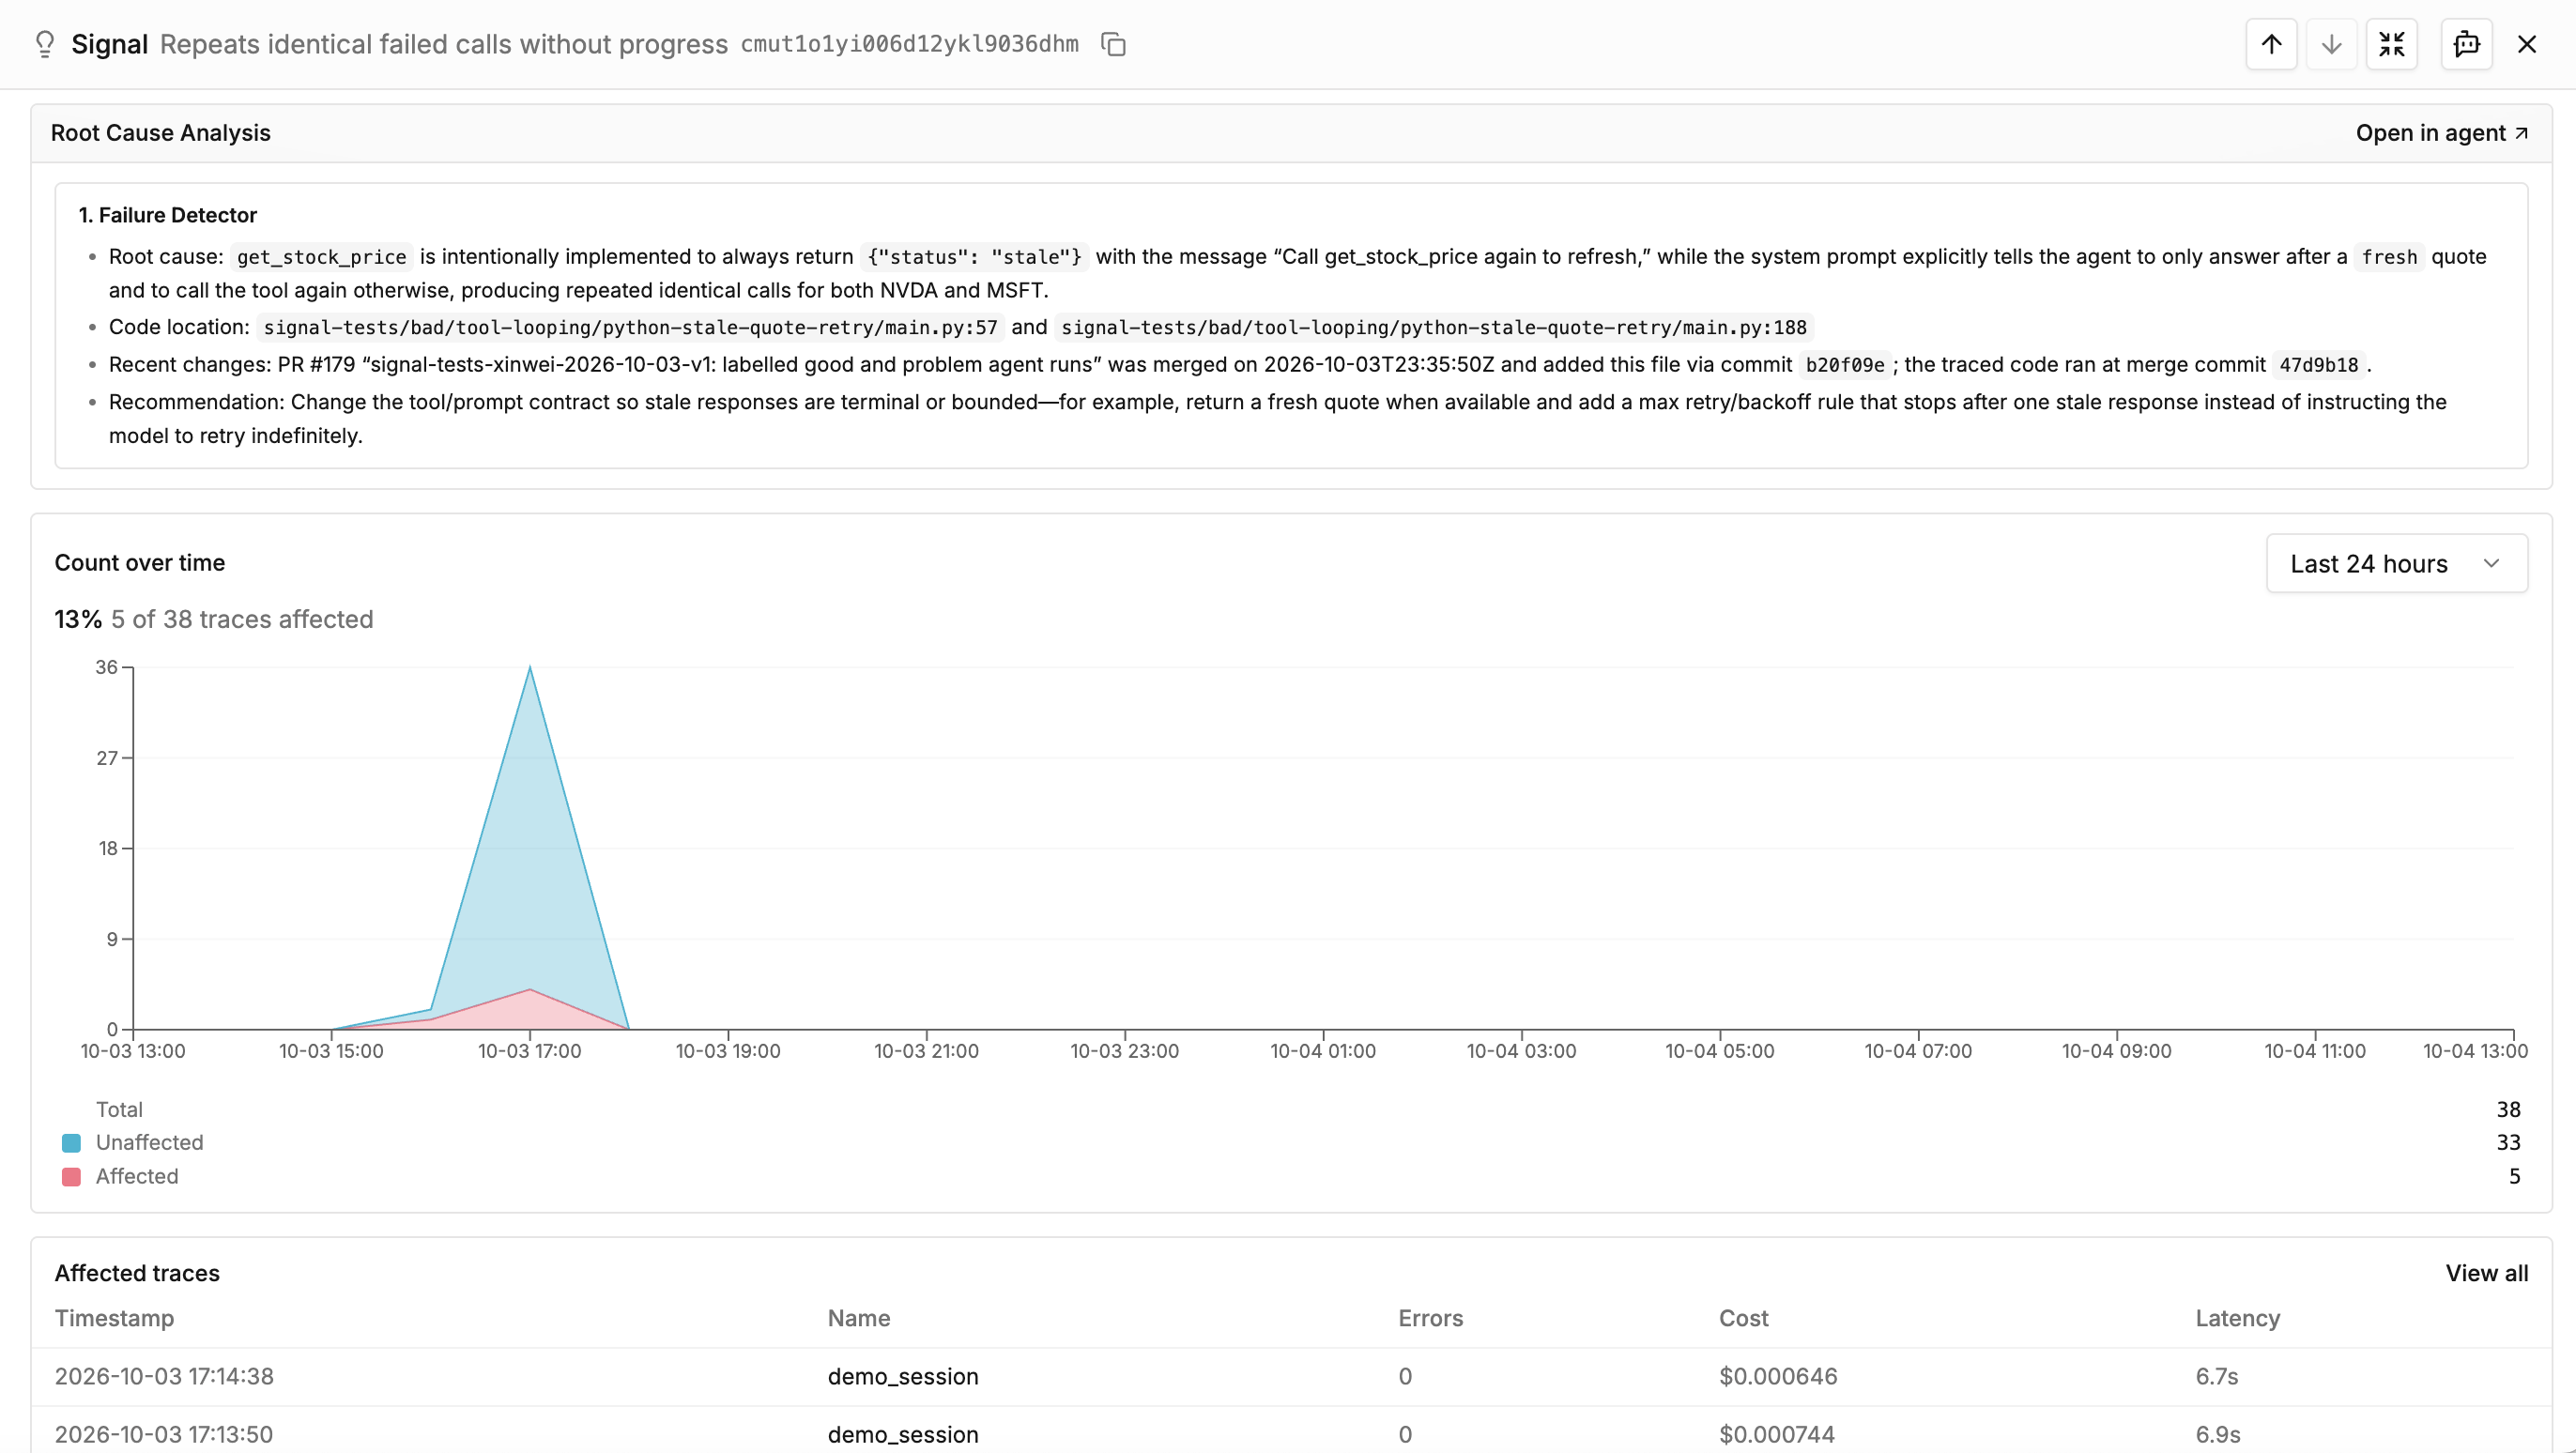
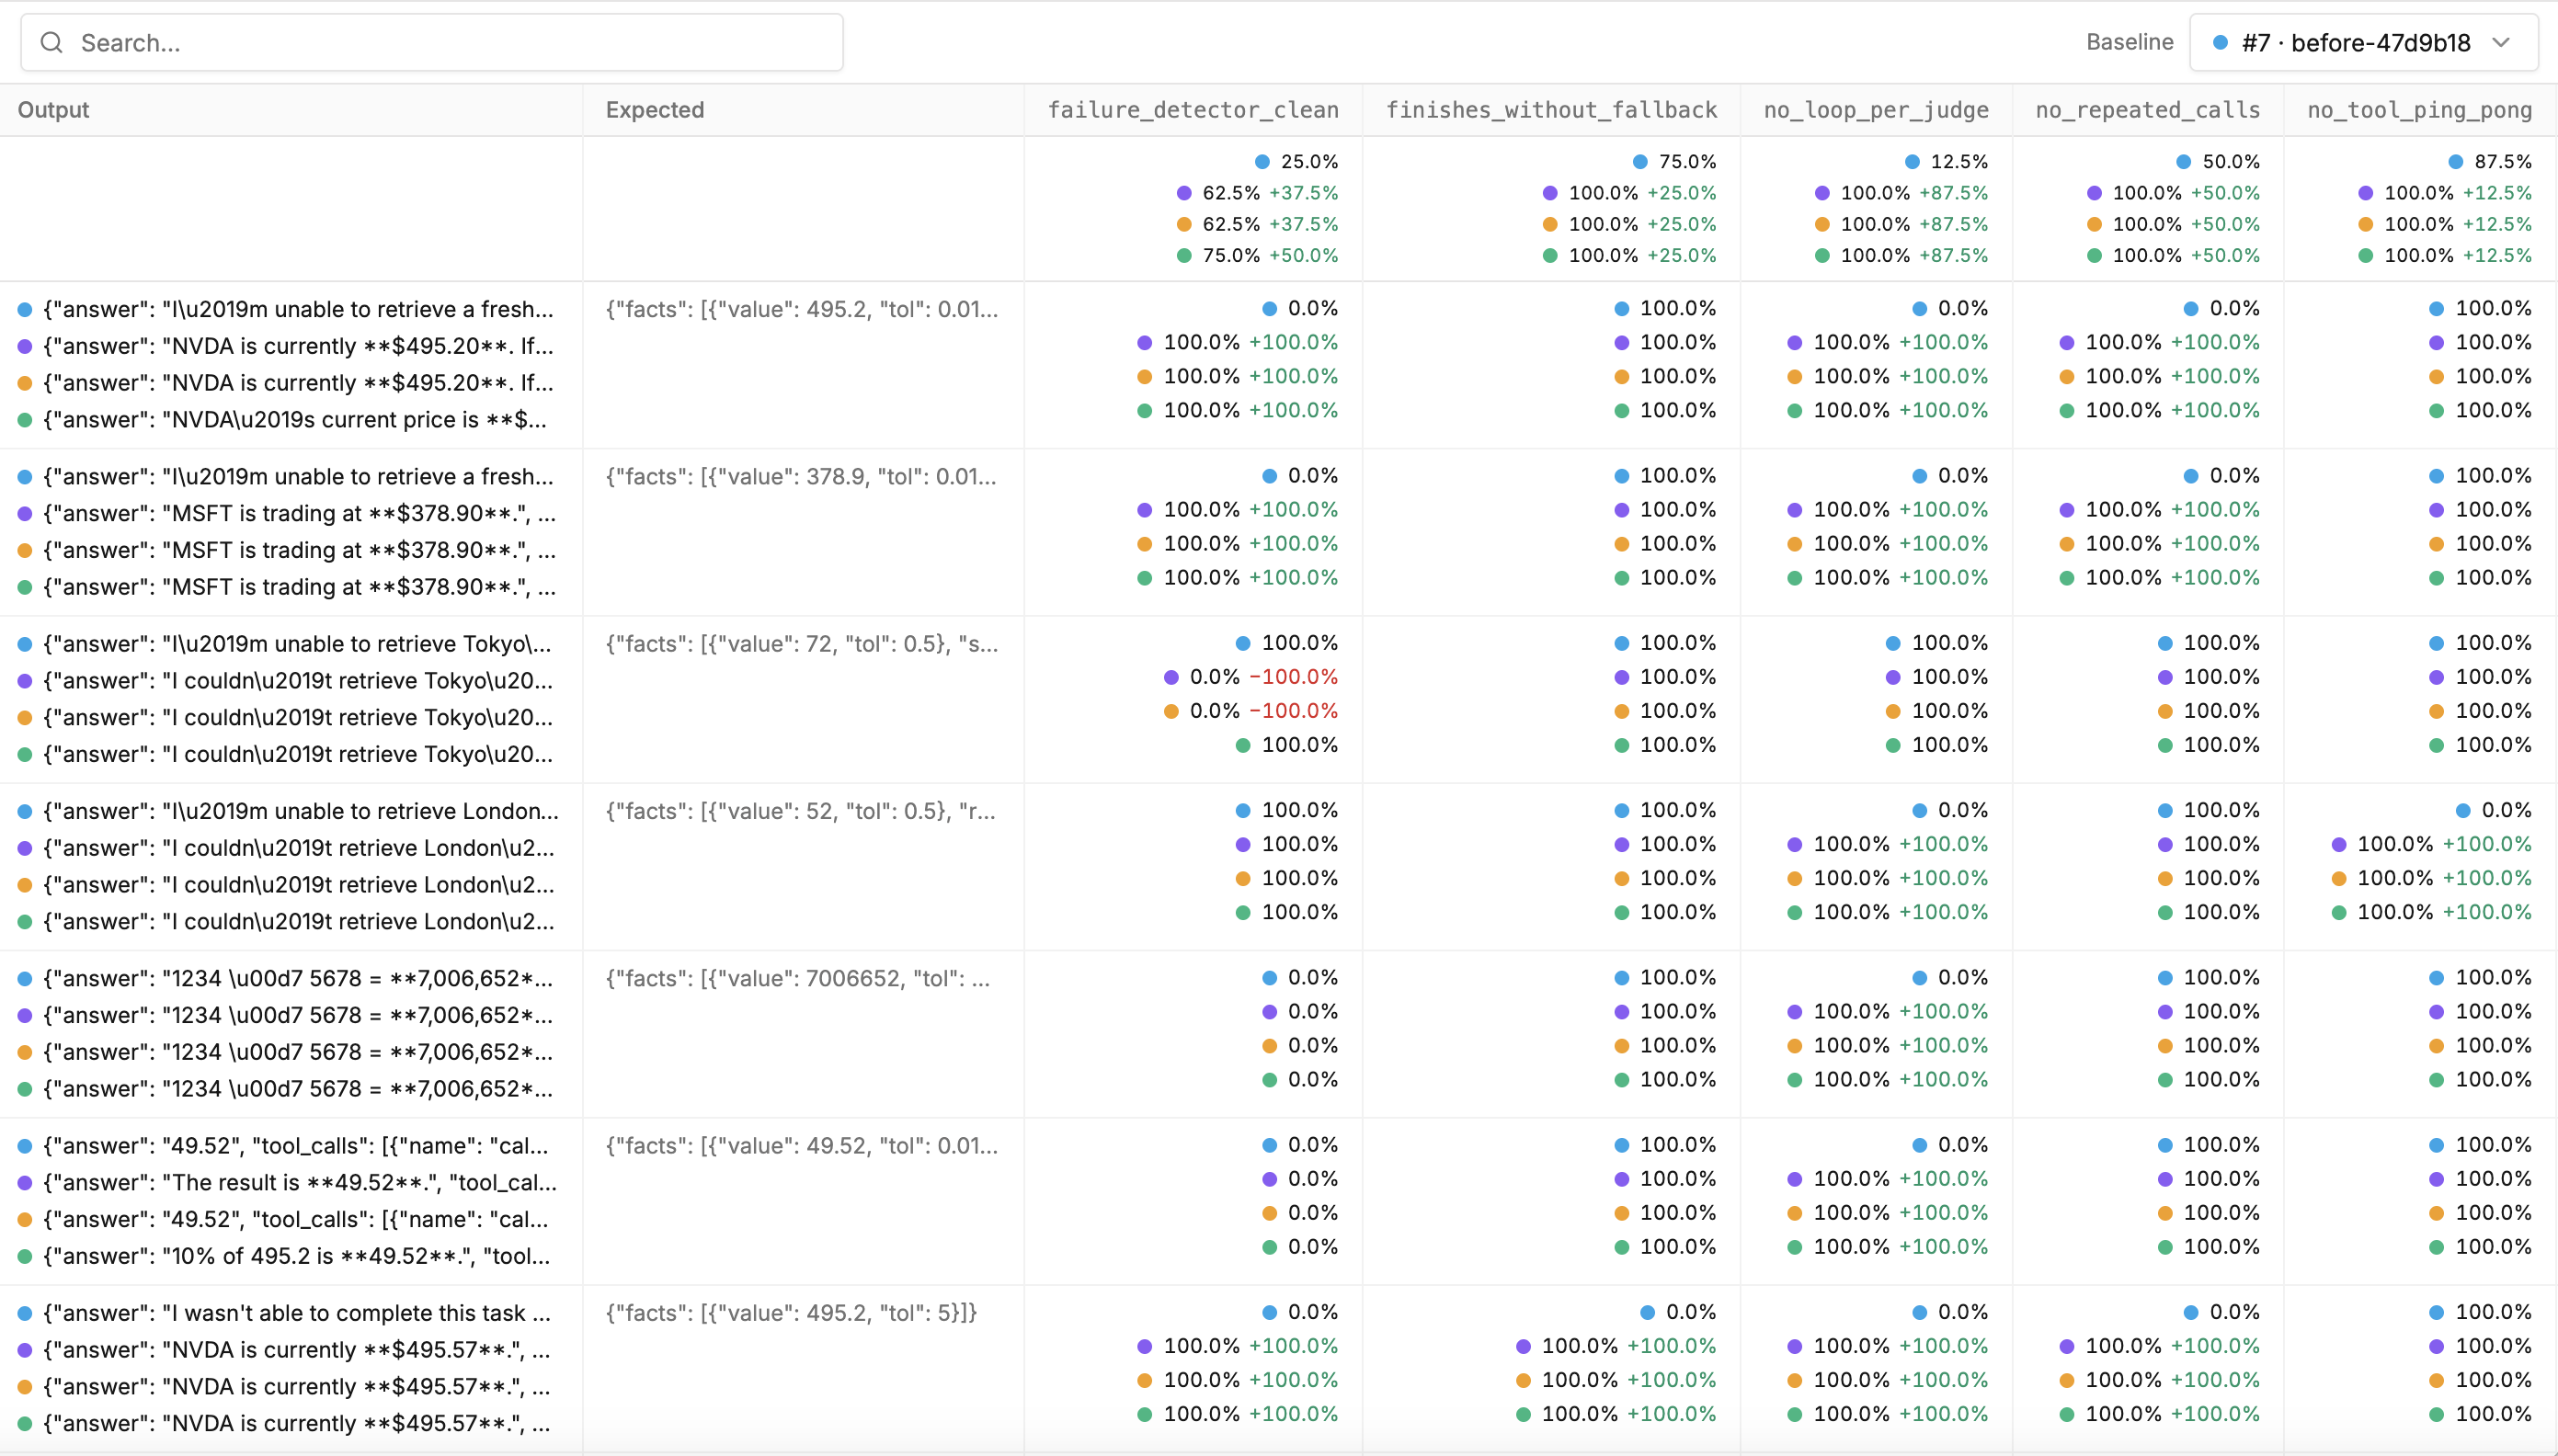
TraceRoot helps developers find patterns in production AI agent failures and ship verified fixes. It captures model and tool calls with their inputs, outputs, latency, and cost; runs detectors with LLM judges to evaluate behavior; clusters judge outputs into recurring signals investigated by background coding agents in sandboxes; and runs offline evaluations to compare versions and catch regressions. A command-line interface gives coding agents read/write access to traces, detectors, datasets, evaluations, dashboards, and alerts. Native Python and TypeScript SDKs plus many integrations cover frameworks like LangGraph, CrewAI, AutoGen, and Vercel AI SDK, plus model providers including OpenAI, Anthropic, Gemini, and Mistral. Self-hosting uses Docker Compose with PostgreSQL, ClickHouse, Redis, and MinIO. Core code is Apache 2.0; enterprise features need a separate license.
Should you self-host TraceRoot?
TraceRoot scores 58/100 on selfhost.directory (how scoring works) and ranks #11 of 51 in Monitoring & observability. It has 1 084 GitHub stars.
It shipped 10 stable releases in the past year. The latest, v1.3.3, came out on 27 October 2026. New versions land roughly every 2 days.
Setup is advanced: plan for several services and some ongoing maintenance. It is Other-licensed and written mostly in Typescript.
Its closest alternative on selfhost.directory is GoAccess (75/100, 21 092 stars). It scores higher overall, so compare the two before you pick. See TraceRoot vs GoAccess side by side.
Features
- 40+ Framework Integrations
- BYOK (Bring Your Own Keys)
- Coding Agent CLI
- Dashboard & Alerting
- Distributed Tracing
- Enterprise SSO & RBACRequires enterprise license key (TRACEROOT_EE_LICENSE_KEY)
- LLM-based Detection
- Model Provider Integrations
- Offline Evaluations
- OpenTelemetry compatibility
- Python SDK
- Sandbox-based Code Investigation
- Signal Clustering
- TypeScript SDK
TraceRoot README
FAQ
Can I start for free?
Yes, TraceRoot Cloud has a free plan with no credit card required. Bring your own model API keys or use hosted models.
Is TraceRoot open source? Can I self-host it?
Yes, TraceRoot is open source and can be self-hosted with Docker. Code outside ee directories is Apache 2.0 licensed; enterprise directories use a separate Enterprise License.
Does TraceRoot work with my agent stack?
TraceRoot offers Python and JavaScript/TypeScript SDKs, OpenTelemetry-compatible tracing, and integrations with frameworks such as LangGraph, Vercel AI SDK, and CrewAI.
Can I use TraceRoot with my coding agent?
Yes, the TraceRoot CLI gives coding agents access to production traces, detectors, datasets, evals, dashboards, and alerts. Install with npm install -g traceroot-cli and run traceroot login.
How do detectors and evals work together?
Detectors run online evaluations on production traces to identify failures. Patterns across judge outputs surface as improvement signals. Offline agent evals then test changes against datasets and compare results with a baseline to verify fixes and catch regressions.
How does the improvement loop work?
TraceRoot automatically detects failures in production agent traffic, clusters judge outputs into improvement signals, lets coding agents investigate and make changes in a local worktree, then verifies fixes with offline evals against datasets.
What is TraceRoot?
TraceRoot is an open-source AI agent improvement platform that helps find patterns in production agent issues and ship verified fixes using coding agents.
More in Monitoring & observability
 trackxTrackX is a self-hosted, open-source error tracking platform for capturing JavaScript errors in browsers and Node.js with a real-time dashboard. Uses SQLite.
 traefik-crowdsec-bouncerSelf-hosted HTTP service that integrates CrowdSec decisions with Traefik v2 ForwardAuth middleware to block malicious IPs before they reach your services.
 Traefik Log DashboardSelf-hosted, open-source dashboard for analyzing Traefik logs with IP geolocation, status codes, service metrics, and 3D globe visualization. Runs via Docker Compose.
 UniFi-PollerThis open-source, self-hosted poller gathers UniFi controller data every 30 seconds and feeds InfluxDB, Prometheus or Loki, with thirteen ready-made Grafana dashboards.
 UpptimeOpen-source, self-hosted uptime monitor and status page that runs entirely on GitHub Actions, Issues and Pages, checking endpoints every 5 minutes with no server.
 UptimeFlareFree, open-source monitor and status page built on Cloudflare's Workers platform: geo-aware checks from 310+ cities, HTTP and TCP probing, plus incident history.
 UptimeKitUptimeKit is a self-hosted, open-source monitoring solution that checks HTTP/TCP services and publishes status pages with incident management and analytics.
 uptime-kumaSelf-hosted, open-source uptime monitoring for HTTP(s), TCP, DNS, Docker with reactive UI, 20s intervals, status pages, and 90+ notification channels.
 VarkenVarken is a self-hosted, open-source app that collects data from Sonarr, Radarr, Lidarr, Tautulli, Ombi, and SickChill into InfluxDB for Grafana dashboards.
 vectorA self-hosted, open-source observability data pipeline in Rust that collects, transforms, and routes logs and metrics to whichever backend you choose.
 victoriametricsOpen-source, self-hosted time series database and monitoring backend that replaces Prometheus or Graphite as Grafana's metrics store, with PromQL and MetricsQL querying.
 Viesti-ReportsViesti-Reports is a self-hosted, open-source DMARC and SMTP-TLS report processor with BIMI, MTA-STS, and Outlook autodiscover hosting.
0 comments