
Self-host adguard-exporter
v1.2.1Prometheus exporter for AdGuard Home DNS metrics
- Stars
- 166
- Port
- 9618 (Prometheus metrics HTTP endpoint)
- Requires
- AdGuard Home
ghcr.io/henrywhitaker3/adguard-exporter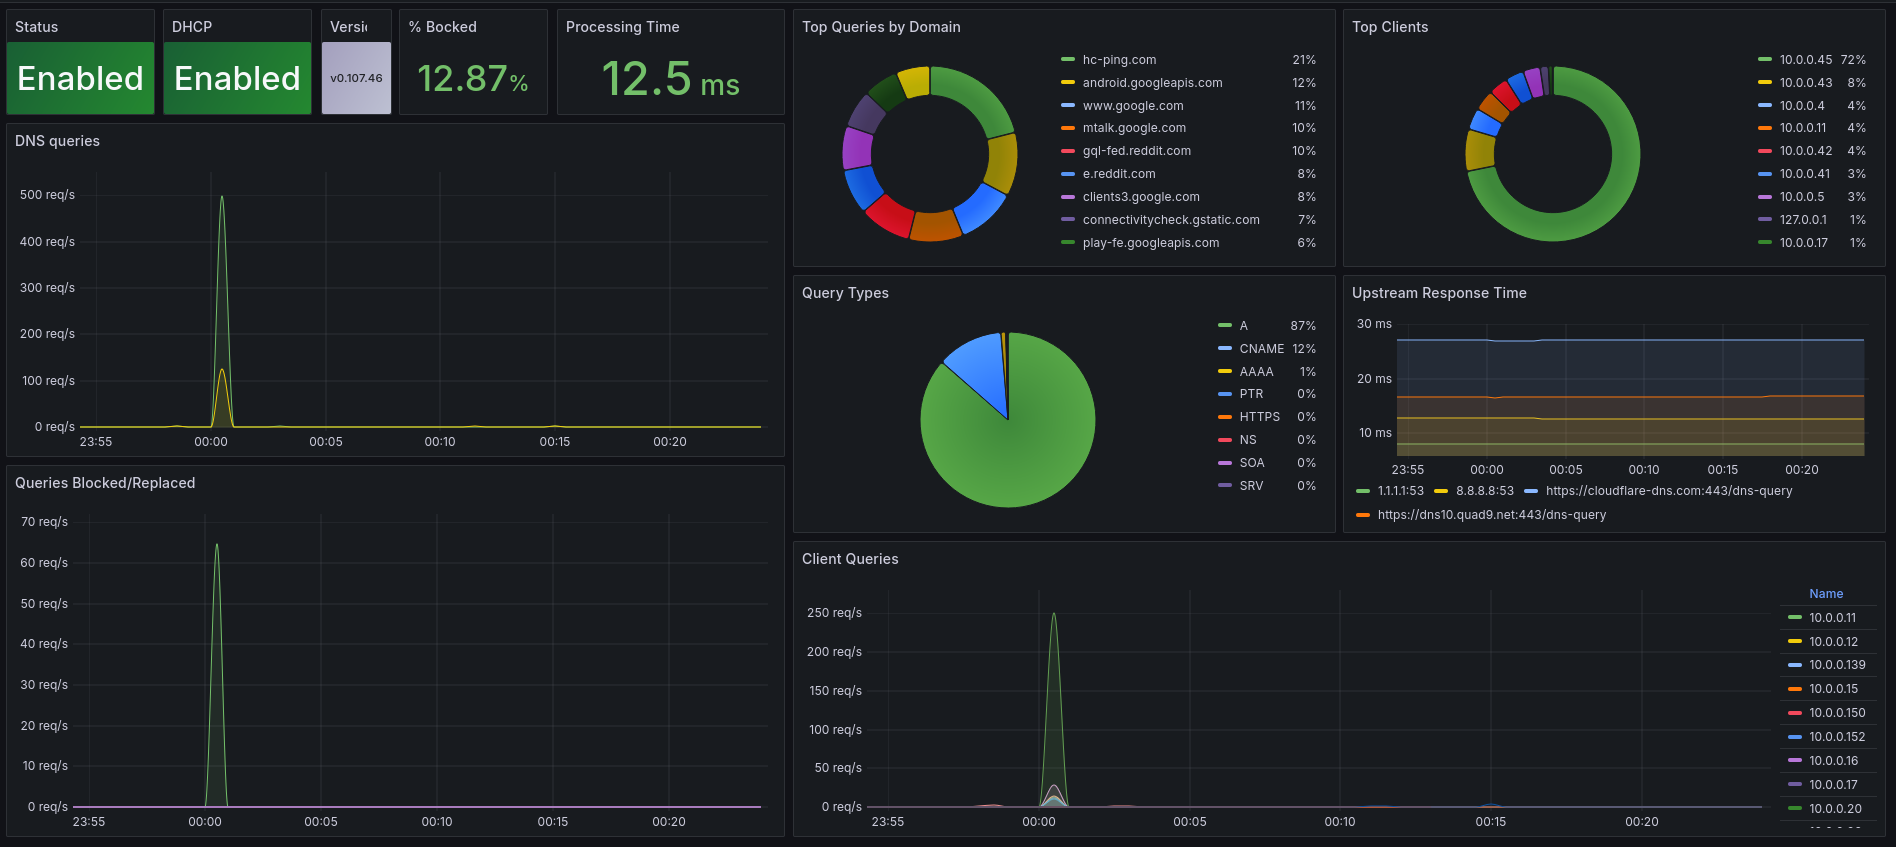
What is adguard-exporter?
AdGuard Home Prometheus Exporter is a self-hosted monitoring tool that connects to one or more AdGuard Home instances and exports their metrics to Prometheus. It collects DNS query counts, blocked queries by category (filter lists, safe search, safe browsing), query processing times, top queried and blocked domains, top clients, upstream server response times, and DHCP lease information. A single exporter instance can monitor multiple AdGuard Home servers by providing comma-separated lists of servers, usernames, and passwords. The exporter runs as a Docker container (ghcr.io/henrywhitaker3/adguard-exporter) and listens on port 9618 by default. It includes a pre-built Grafana dashboard for visualization. The project is open-source under the MIT license.
adguard-exporter alternatives
 AdGuard HomeSelf-hosted open-source DNS server blocking ads/trackers network-wide. Supports encrypted DNS, parental controls, safe search, per-client config, DHCP.CompareAdGuard Home with adguard-exporter
 docker-adguardMinimal, security-hardened Docker image for self-hosted AdGuard Home ad blocking. Runs rootless, distroless from scratch, with health checks and CVE scanning.Comparedocker-adguard with adguard-exporter
 adguard-buddySelf-hosted dashboard for monitoring and synchronizing multiple AdGuard Home servers with merged query logs, statistics, and drift detection.Compareadguard-buddy with adguard-exporter
 Node ExporterOpen-source metrics exporter for Unix systems hardware and OS data. Collects CPU, memory, disk, network stats via pluggable collectors.CompareNode Exporter with adguard-exporter
 NetProbe_PythonA containerized network monitor that checks connectivity, DNS response times, and bandwidth, then shows results in a dark-themed web dashboard with historical graphs.CompareNetProbe_Python with adguard-exporter
 exportarrA self-hosted Prometheus exporter that monitors popular *arr suite applications. Exports metrics as HTTP endpoints with granular opt-out flags for expensive endpoints.Compareexportarr with adguard-exporter
 dockpromdockprom is a self-hosted, open-source Docker monitoring stack with Prometheus, Grafana, cAdvisor, NodeExporter, AlertManager, Pushgateway, and Caddy in one Compose file.Comparedockprom with adguard-exporter
 prometheus-qbittorrent-exporterSelf-hosted, open-source Prometheus exporter that collects metrics from qBittorrent servers and exposes them for monitoring. Runs via pip or Docker.Compareprometheus-qbittorrent-exporter with adguard-exporter
Should you self-host adguard-exporter?
adguard-exporter scores 43/100 on selfhost.directory (how scoring works) and ranks #82 of 104 in Monitoring & observability. It has 166 GitHub stars.
There was no stable release in the past 12 months, so check the repository's recent activity before you rely on it.
Setup is easy: most people get it running in one sitting. An official Docker image is available. It is MIT-licensed and written mostly in Go.
Its closest alternative on selfhost.directory is grafana (90/100, 77 585 stars). It scores higher overall, so compare the two before you pick. See adguard-exporter vs grafana side by side.
Features
- Blocking metrics
- DHCP monitoring
- DNS query statistics
- Grafana dashboard included
- Multi-instance monitoring
- Prometheus metrics export
- Top domains and clients
- Upstream server monitoring
adguard-exporter README
This is a Prometheus exporter for AdGuard Home.

More in Monitoring & observability
 ADS-BitSelf-hosted open-source flight tracker that renders live ADS-B data as retro pixel art sprites with animated sky, weather, and an in-browser sprite editor.
 agentic-chatopsSelf-hosted agentic ChatOps platform with 3-tier AI architecture that triages alerts, predicts remediation impact via causal graph, and auto-resolves routine issues.
 AiSOCSelf-hosted, open-source AI SOC with 2,535 detection rules and agents that record every step in an auditable ledger. MIT licensed, no API keys needed.
 AlloySelf-hosted OpenTelemetry Collector with Prometheus pipelines. Programmable pipelines, clustering, Loki/Tempo/Mimir/Pyroscope integrations.
 Apache SkyWalkingOpen-source, self-hosted APM platform for cloud-native systems: tracing, metrics, logs, profiling and alerting on pluggable storage such as BanyanDB.
 arewedownAre We Down? is a self-hosted, open-source uptime monitor with a web dashboard checking HTTP, SSH, Docker, and more, alerting via email and Slack.
 ArgusSelf-hosted open-source tool that monitors software releases from GitHub, websites, and Docker registries, then sends notifications and webhooks on new versions.
 arize-phoenixSelf-hosted AI observability for LLM apps: OTLP tracing, LLM-as-judge evals, datasets, experiments, and a prompt playground, run via pip, Docker, or Kubernetes.
 AutoKumaAutoKuma is a self-hosted, open-source tool that automatically creates Uptime Kuma monitors from Docker container labels, removing manual UI configuration.
 AWStatsAWStats is a self-hosted, open-source log analyzer generating advanced web, FTP, and mail statistics from Apache, IIS, and other server logs.
 BambuddySelf-hosted Bambu Lab printer control plane with local monitoring, print queuing, archiving, browser slicing, and filament tracking — no vendor cloud needed.
 bamdudeSelf-hosted, open-source command center for Bambu Lab 3D printers with real-time monitoring, per-printer queues, print archiving, Telegram bot, and filament tracking.
0 comments